
PHP5.3或之前版本可以去pecl(http://pecl.php.net)下载xhprof扩展安装。
但pecl上的版本不支持PHP5.4
可以到github上的xhprof库中下载:https://github.com/facebook/xhprof
下载后进行解压安装
1 cd xhprof-master/extension/
2 phpize
3 ./configure --enable-xhprof
4 make
5 sudo make install
更改php.ini
1 [xhprof]
2 extension=xhprof.so
3 xhprof.output_dir="/document/gbyukg/www/test/xhprof"
重新启动apache。
简单使用:

1 // start profiling
2 xhprof_enable();
3
4 // run program
5 ......
6
7 // stop profiler
8 $xhprof_data = xhprof_disable();
xhprof_enable()允许接收一些参数,默认情况下,只会统计方法的调用次数和消耗的时间,通过传递参数(XHPROF_FLAGS_CPU + XHPROF_FLAGS_MEMORY)打开统计CPU和内存使用率(在实际生产环境中会好关闭CPU统计信息,因为它会占用很多资源),同样也可以通过传递XHPROF_FLAGS_NO_BUILTINS参数来禁用对PHP内置函数的统计,甚至通过传递第二个参数来禁用对指定函数的统计,如:
1 // ignore builtin functions and call_user_func* during profiling
2 $ignore = array('call_user_func', 'call_user_func_array');
3 xhprof_enable(0, array('ignored_functions' =>  $ignore));
xhprof界面工具
页面工具存储在源代码目录中的xhprof_html文件夹下,同时需要xhprof_lib文件夹下的库文件。将这2个文件夹放到php.ini文件中指定的报告生成的目录中(应当是web服务器目录中)。
创建头和尾文件:
1 <?php
2 if (extension_loaded('xhprof')) {
3     include_once '/usr/local/lib/php/xhprof_lib/utils/xhprof_lib.php';
4     include_once '/usr/local/lib/php/xhprof_lib/utils/xhprof_runs.php';
5     xhprof_enable(XHPROF_FLAGS_CPU + XHPROF_FLAGS_MEMORY);
6 }
 1 if (extension_loaded('xhprof')) {
 2     $profiler_namespace = 'myapp';  // namespace for your application
 3     $xhprof_data = xhprof_disable();
 4     $xhprof_runs = new XHProfRuns_Default();
 5     $run_id = $xhprof_runs->save_run($xhprof_data, $profiler_namespace);
 6
 7     // url to the XHProf UI libraries (change the host name and path)
 8     $profiler_url = sprintf('http://myhost.com/xhprof/xhprof_html/index.php?run=%s&source=%s', $run_id, $profiler_namespace);
 9     echo '<a href="'. $profiler_url .'" target="_blank">Profiler output</a>';
10 }
最后配置.htaccess文件使之自动调用上述2个文件
1 php_value auto_prepend_file /document/gbyukg/www/xhprof/header.php
2 php_value auto_append_file /document/gbyukg/www/xhprof/footer.php
之后访问xhprof_html目录下的index.php文件
// start profiling
xhprof_enable();
//profile CPU time and/or memory usage
xhprof_enable(XHPROF_FLAGS_CPU + XHPROF_FLAGS_MEMORY);

// run program
......

// stop profiler
$xhprof_data = xhprof_disable();
 1 // start profiling
 2 xhprof_enable();
 3
 4 // run program
 5 ....
 6
 7 // stop profiler
 8 $xhprof_data = xhprof_disable();
 9
10 //
11 // Saving the XHProf run
12 // using the default implementation of iXHProfRuns.
13 //
14 include_once $XHPROF_ROOT . "/xhprof_lib/utils/xhprof_lib.php";
15 include_once $XHPROF_ROOT . "/xhprof_lib/utils/xhprof_runs.php";
16
17 $xhprof_runs = new XHProfRuns_Default();
18
19 // Save the run under a namespace "xhprof_foo".
20 //
21 // **NOTE**:
22 // By default save_run() will automatically generate a unique
23 // run id for you. [You can override that behavior by passing
24 // a run id (optional arg) to the save_run() method instead.]
25 //
26 $run_id = $xhprof_runs->save_run($xhprof_data, "xhprof_foo");
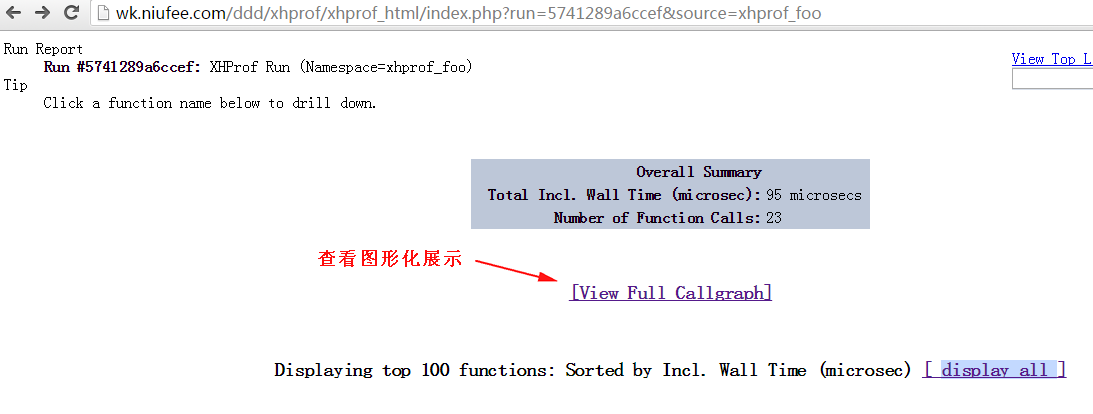
在生成的统计表格中,可以按照各个统计列进行排序,如:
Number of Calls:方法的调用次数
Memory Usage:内存占用率
Peak Memory Usage:内存峰值
CUP Time:CPU占用时间(包括内核使用时间和用户代码调用时间)
Wall Time:执行时间(如果执行一个远程调用,会包括CPU访问远程服务器、解析响应以及等待响应的时间和其它一些资源所占用的时间)
内存占用情况和CPU使用时间更进一步的分为Inclusive和Exclusive
Inclusive Time 包含该方法自己所占用的时间和该方法的所有子孙方法所占用的总资源或时间
Exclusive Time 仅仅包含该方法本身所占用的资源或时间
使用图形界面
可以通过点击页面上方的View Full Callgraph链接打开生成的图像模型,注意,在使用此功能前,请确保系统已经安装过GraphViz,Ubunt中可通过下面命令进行安装:
1 apt-get install graphviz
当需要对当前项目进行优化时,我们首先需要对CPU进行排序,找出CPU占用时间最多的方法进行优化,之后按照优化内存使用率进行排序,对内存使用率最高的方法进行优化,接着按照wall time进行排序优化。
差别与统计报告
XHProf允许你对两次统计结果进行对比,对比方式是:
1 http://%xhprof-ui-address%/index.php?run1=XXX&run2=YYY&source=myapp
XXX和YYY是run id,myapp是命名空间,即save_run的第二个参数
同样也可以经多次生成的统计结果合并到一起生成一个统计报告:
1 http://%xhprof-ui-address%/index.php?run=XXX,YYY,ZZZ&source=myapp
提示:
在对项目进行优化时,首先需要知道哪些地方需要优化,例如,项目中使用Zend Framewor,首先需要知道运行ZF框架所需要的资源以及时间,如果ZF运行时需要占用2.5M内存,那么不可能要让整个项目的内存占用小于2.5M。
同时并不需要每次运行都生成统计报告,可修改头问文件使之运行1000次生成一次报告。
header.php
1 $xhprof_on = false;
2 if (mt_rand(1, 10000) === 1) {
3     $xhprof_on = true;
4     if (extension_loaded('xhprof')) {
5         include_once '/usr/local/lib/php/xhprof_lib/utils/xhprof_lib.php';
6         include_once '/usr/local/lib/php/xhprof_lib/utils/xhprof_runs.php';
7         xhprof_enable(XHPROF_FLAGS_CPU + XHPROF_FLAGS_MEMORY);
8     }
9 }
footer.php
 1 if ($xhprof_on && extension_loaded('xhprof')) {
 2     $profiler_namespace = 'myapp';  // namespace for your application
 3     $xhprof_data = xhprof_disable();
 4     $xhprof_runs = new XHProfRuns_Default();
 5     $run_id = $xhprof_runs->save_run($xhprof_data, $profiler_namespace);
 6
 7     // url to the XHProf UI libraries (change the host name and path)
 8     $profiler_url = sprintf('http://myhost.com/xhprof/xhprof_html/index.php?run=%s&source=%s', $run_id, $profiler_namespace);
 9     echo '<a href="'.$profiler_url.'" target="_blank">Profiler output</a>';
10 }
来自 https://www.cnblogs.com/gbyukg/archive/2013/01/31/2888183.html
xhprof扩展的安装和简单使用
版权声明:本文为博主原创文章,未经博主允许不得转载。https://blog.csdn.net/liuzp111/article/details/51474197
查看是否是否安装xhprof扩展
php --ri xhprof #检查php是否有这个扩展
1
xhprof扩展的安装
wget http://pecl.php.net/get/xhprof-0.9.4.tgz
tar zxvf xhprof-0.9.4.tgz
cd xhprof-0.9.4
whereis phpize
/usr/bin/phpize
1
2
3
4
5
执行到这里报错了,错误信息如下:
[root@fengniu020 xhprof-0.9.4]# /usr/bin/phpize
Cannot find config.m4.
Make sure that you run '/usr/bin/phpize' in the top level source directory of the module

[root@fengniu020 xhprof-0.9.4]#
1
2
3
4
5
咋办呢?
参考:安装PHP扩展 xhprof 报错 Cannot find config.m4 的解决办法
[root@fengniu020 xhprof-0.9.4]# /usr/bin/phpize
Cannot find config.m4.
Make sure that you run '/usr/bin/phpize' in the top level source directory of the module

[root@fengniu020 xhprof-0.9.4]# l
-bash: l: command not found
[root@fengniu020 xhprof-0.9.4]# ls
CHANGELOG  examples   LICENSE  xhprof_html
CREDITS    extension  README   xhprof_lib
[root@fengniu020 xhprof-0.9.4]# cd extension/
[root@fengniu020 extension]# ls
config.m4  php_xhprof.h  tests  xhprof.c
[root@fengniu020 extension]# phpize
Configuring for:
PHP Api Version:         20100412
Zend Module Api No:      20100525
Zend Extension Api No:   220100525
[root@fengniu020 extension]#
1
2
3
4
5
6
7
8
9
10
11
12
13
14
15
16
17
18
解决了安装错误,继续安装
 whereis php-config#查找php-config的位置
 ./configure --with-php-config=/usr/bin/php-config
 make && make install
 vim /etc/php.ini
1
2
3
4
在php.ini中加入此扩展
extension = xhprof.so
1
重启php-fpm生效
service php-fpm restart
1
在脚本中开始处使用xhprof_enable()开启
在脚本之后使用 $data = xhprof_disable() 返回数据
运行下xhprof,试试效果,可能可以正常运行不:
我的xhprof安装目录是在:
/hotdata/soft
1
现在建立个测试目录,并有一个域名指向到/hotdata/kehu/wk
/hotdata/kehu/wk/ddd/
1
把安装目录的文件夹拷贝到测试目录下
 cp -Rf ./xhprof-0.9.4  /hotdata/kehu/wk/ddd/
 mv xhprof-0.9.4 xhprof
1
2
在浏览器上运行官方提供的例子
http://wk.baidu.com/ddd/xhprof/examples/sample.php
1
可以看到有如下结果
第一种方式:复制上面到运行的结果(http路径),再次放入浏览器,填好前面对应的域名:
http://wk.baidu.com/ddd/xhprof/xhprof_html/index.php?run=5741289a6ccef&source=xhprof_foo
1
可以看到结果:
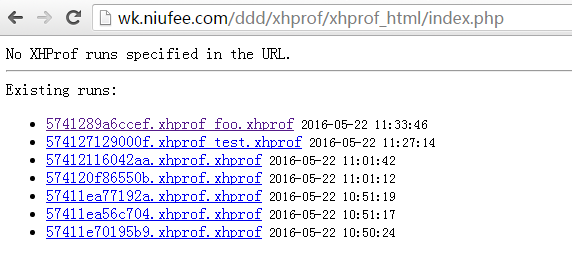
第二种方式:
直接访问
http://wk.baidu.com/ddd/xhprof/xhprof_html/index.php
1
这里会展示检测到运行过的id
如果查看图形化展示
报错了:
failed to execute cmd:" dot -Tpng". stderr:`sh: dot:command not found`
1
解决办法:
yum install graphviz
1
再点击就可以看到图形化展示了
可参考这个链接,写的很不错:
XHProf的安装和使用(PHP性能测试神器)
PHP官网链接:
http://php.net/manual/zh/intro.xhprof.php
facebook文档:
http://web.archive.org/web/20110514095512/http://mirror.facebook.net/facebook/xhprof/doc.html
---------------------
作者:Everything1209
来源:CSDN
原文:https://blog.csdn.net/everything1209/article/details/51474197
版权声明:本文为博主原创文章,转载请附上博文链接!
查看是否是否安装xhprof扩展
1
xhprof扩展的安装
1
2
3
4
5
执行到这里报错了,错误信息如下:
1
2
3
4
5
咋办呢?
参考:安装PHP扩展 xhprof 报错 Cannot find config.m4 的解决办法
1
2
3
4
5
6
7
8
9
10
11
12
13
14
15
16
17
18
解决了安装错误,继续安装
1
2
3
4
在php.ini中加入此扩展
1
重启php-fpm生效
1
在脚本中开始处使用xhprof_enable()开启
在脚本之后使用 $data = xhprof_disable() 返回数据
运行下xhprof,试试效果,可能可以正常运行不:
我的xhprof安装目录是在:
1
现在建立个测试目录,并有一个域名指向到/hotdata/kehu/wk
1
把安装目录的文件夹拷贝到测试目录下
1
2
在浏览器上运行官方提供的例子
1
可以看到有如下结果 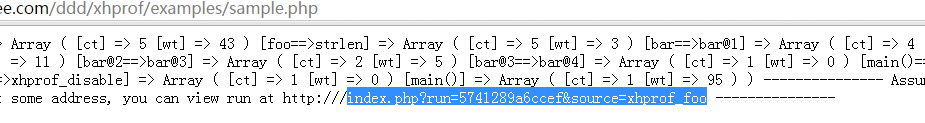
第一种方式:复制上面到运行的结果(http路径),再次放入浏览器,填好前面对应的域名:
1
可以看到结果:
第二种方式:
直接访问
1
这里会展示检测到运行过的id
如果查看图形化展示
报错了:
1
解决办法:
1
再点击就可以看到图形化展示了 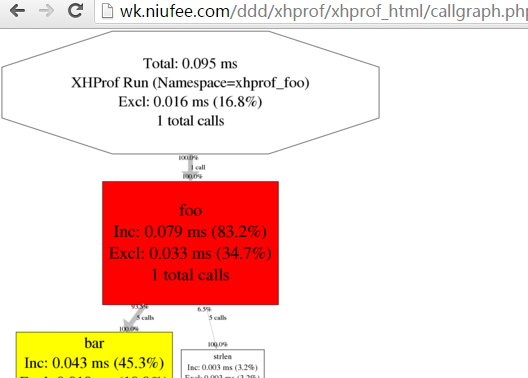
可参考这个链接,写的很不错:
XHProf的安装和使用(PHP性能测试神器)
PHP官网链接:
http://php.net/manual/zh/intro.xhprof.php
facebook文档:
http://web.archive.org/web/20110514095512/http://mirror.facebook.net/facebook/xhprof/doc.html