查看是否是否安装xhprof扩展
php --ri xhprof
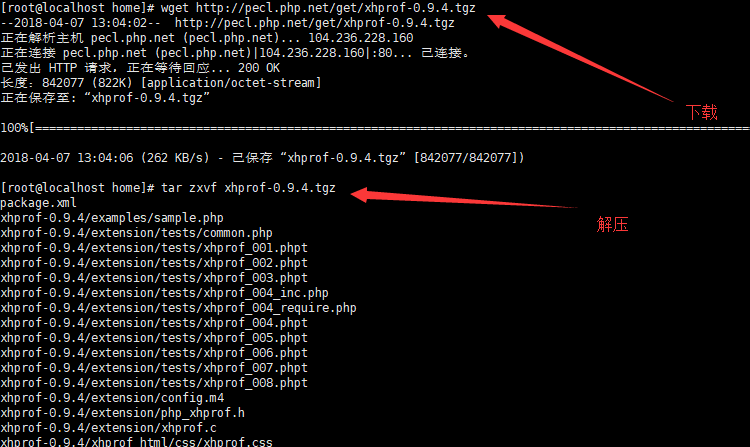
xhprof扩展的安装
wget http://pecl.php.net/get/xhprof-0.9.4.tgz
tar zxvf xhprof-0.9.4.tgz
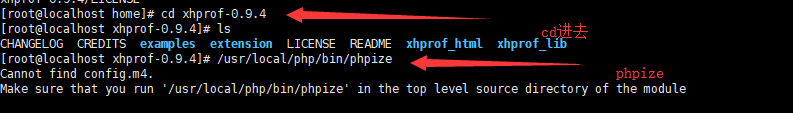
cd xhprof-0.9.4
whereis phpize
/usr/bin/phpize
执行到这里报错了,错误信息如下:
[root@fengniu020 xhprof-0.9.4]
Cannot find config.m4.
Make sure that you run '/usr/bin/phpize' in the top level source directory of the module
[root@fengniu020 xhprof-0.9.4]
咋办呢?
参考:安装PHP扩展 xhprof 报错 Cannot find config.m4 的解决办法
[root@fengniu020 xhprof-0.9.4]
Cannot find config.m4.
Make sure that you run '/usr/bin/phpize' in the top level source directory of the module
[root@fengniu020 xhprof-0.9.4]
-bash: l: command not found
[root@fengniu020 xhprof-0.9.4]
CHANGELOG examples LICENSE xhprof_html
CREDITS extension README xhprof_lib
[root@fengniu020 xhprof-0.9.4]
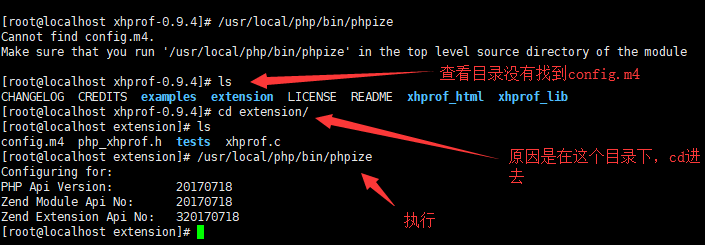
[root@fengniu020 extension]
config.m4 php_xhprof.h tests xhprof.c
[root@fengniu020 extension]
Configuring for:
PHP Api Version: 20100412
Zend Module Api No: 20100525
Zend Extension Api No: 220100525
[root@fengniu020 extension]
1
2
3
4
5
6
7
8
9
10
11
12
13
14
15
16
17
18
解决了安装错误,继续安装
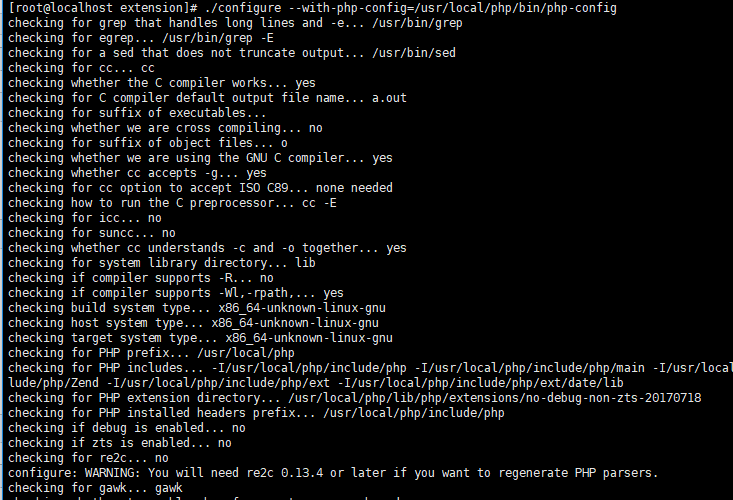
whereis php-config#查找php-config的位置
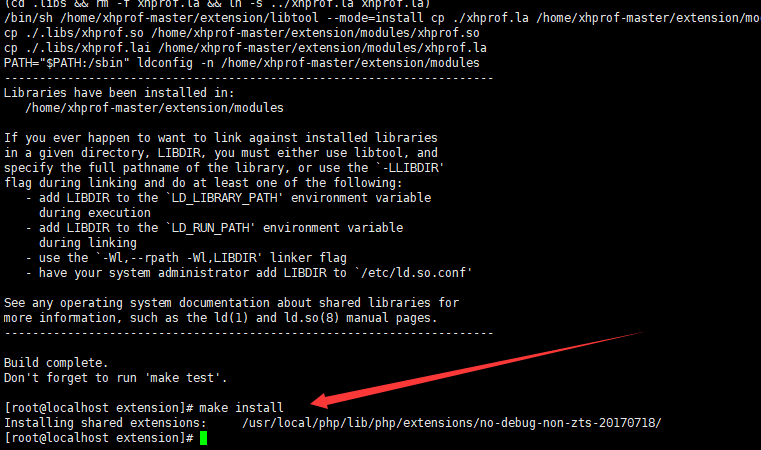
./configure --with-php-config=/usr/bin/php-config
make && make install
vim /etc/php.ini
在php.ini中加入此扩展
extension = xhprof.so
重启php-fpm生效
service php-fpm restart
在脚本中开始处使用xhprof_enable()开启
在脚本之后使用 $data = xhprof_disable() 返回数据
运行下xhprof,试试效果,可能可以正常运行不:
我的xhprof安装目录是在:
/hotdata/soft
现在建立个测试目录,并有一个域名指向到/hotdata/kehu/wk
/hotdata/kehu/wk/ddd/
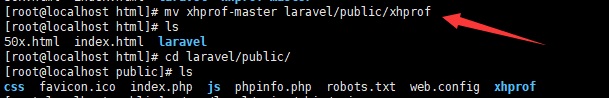
把安装目录的文件夹拷贝到测试目录下
 cp -Rf ./xhprof-0.9.4  /hotdata/kehu/wk/ddd/
 mv xhprof-0.9.4 xhprof
在浏览器上运行官方提供的例子
http://wk.baidu.com/ddd/xhprof/examples/sample.php
可以看到有如下结果
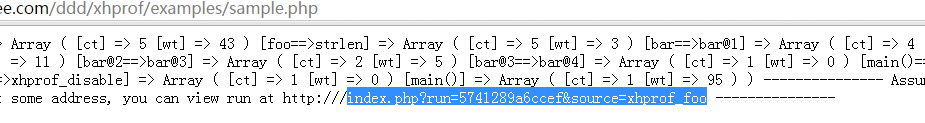
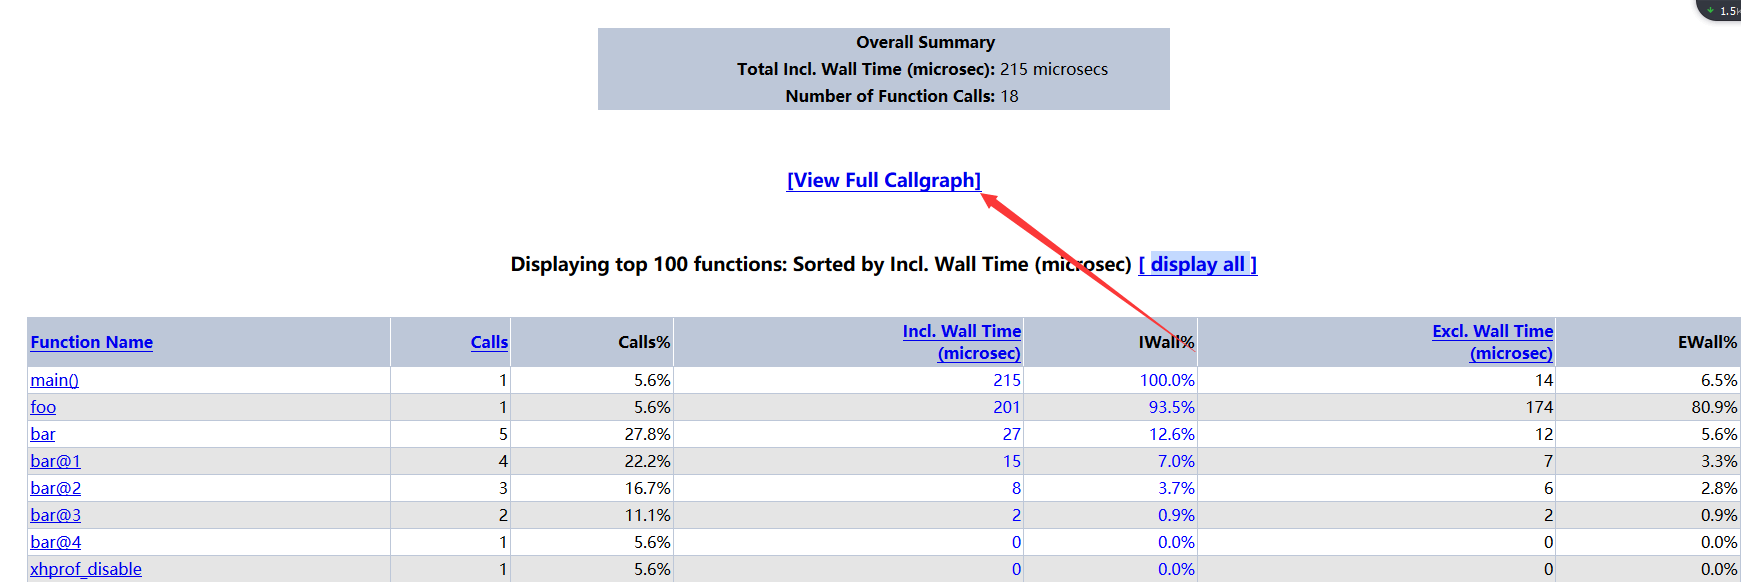
第一种方式:复制上面到运行的结果(http路径),再次放入浏览器,填好前面对应的域名:
http://wk.baidu.com/ddd/xhprof/xhprof_html/index.php?run=5741289a6ccef&source=xhprof_foo
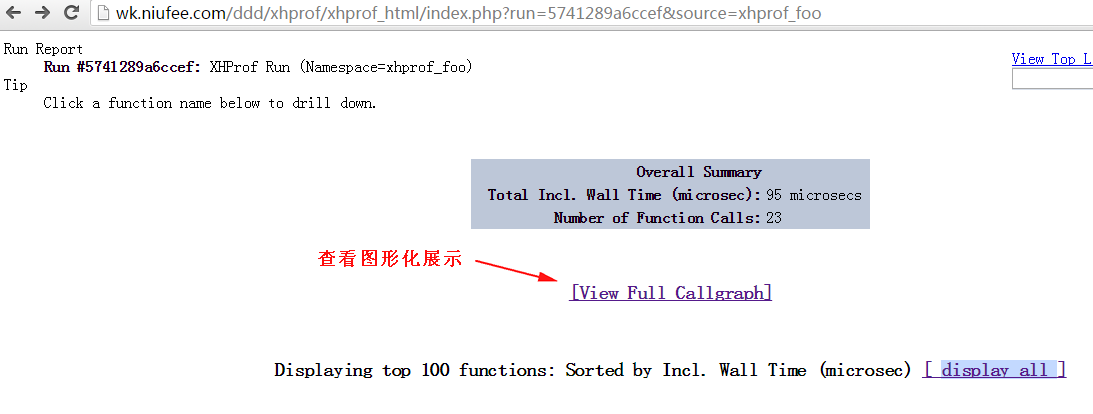
可以看到结果:
第二种方式:
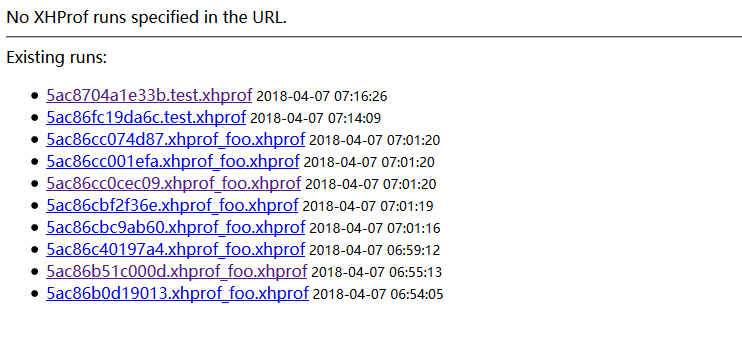
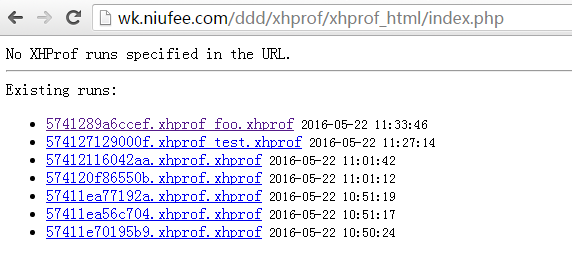
直接访问
http://wk.baidu.com/ddd/xhprof/xhprof_html/index.php
这里会展示检测到运行过的id
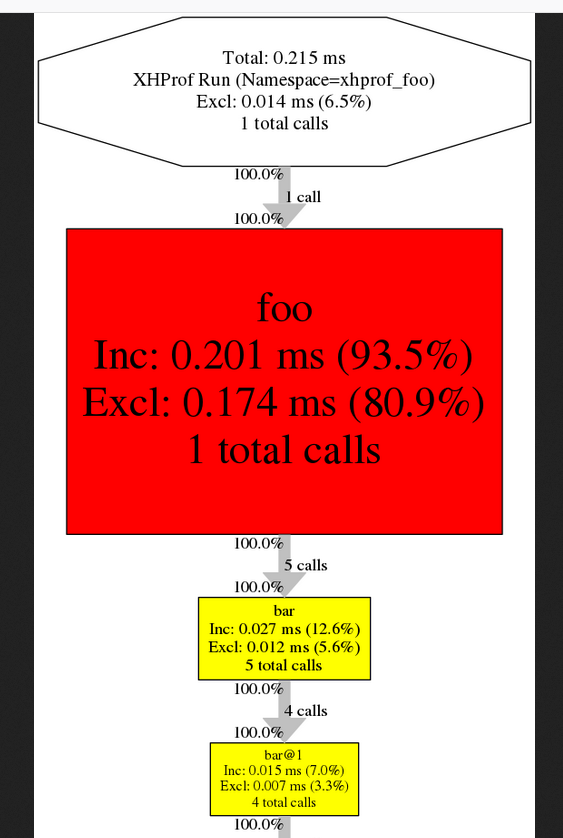
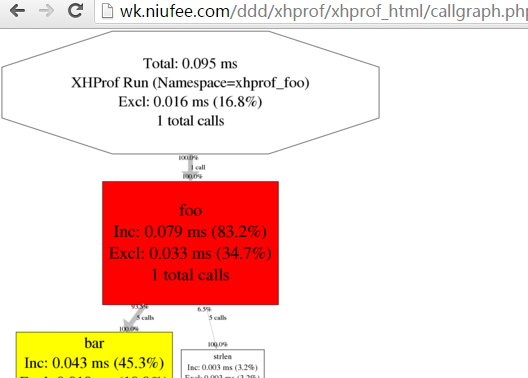
如果查看图形化展示
报错了:
failed to execute cmd:" dot -Tpng". stderr:`sh: dot:command not found`
解决办法:
yum install graphviz
再点击就可以看到图形化展示了
可参考这个链接,写的很不错:
XHProf的安装和使用(PHP性能测试神器)
PHP官网链接:
http://php.net/manual/zh/intro.xhprof.php
facebook文档:
http://web.archive.org/web/20110514095512/http://mirror.facebook.net/facebook/xhprof/doc.html