大致思路也就是下面,由于最近在学Laravel也在学Angularjs,加上之前做的项目用到了d3。
原来的方案如下:
jQuery+highchart.js+Django
jQuery主要于ajax,以及Json解析 详情可见:http://api.phodal.com
现在的方案就变成了
Laravel+Angularjs+D3+Bootstrap
效果可见:www.xianuniversity.com/athome
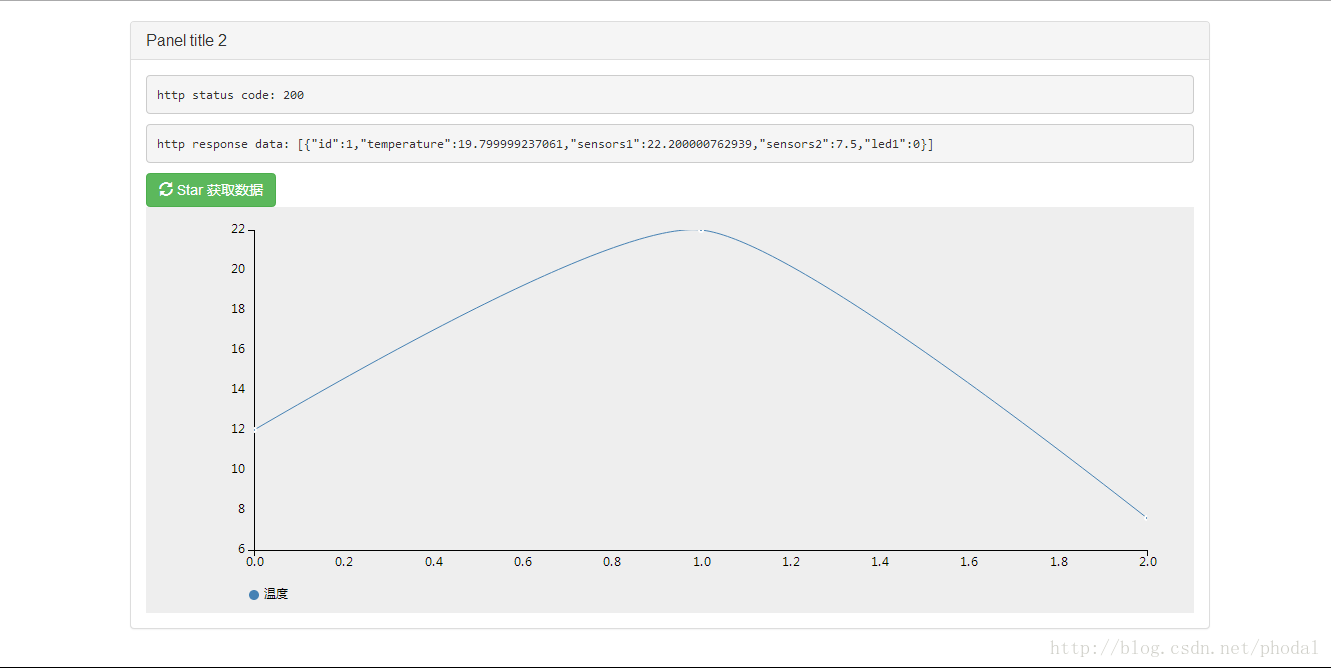
最后效果图如下所示:
代码可见:https://github.com/gmszone/learingphp
框架简介
Laravel
Angular
AngularJS 是一个为动态WEB应用设计的结构框架。它能让你使用HTML作为模板语言,通过扩展HTML的语法,让你能更清楚、简洁地构建你的应用组件。它的创新点在于,利用 数据绑定 和 依赖注入,它使你不用再写大量的代码了。这些全都是通过浏览器端的Javascript实现,这也使得它能够完美地和任何服务器端技术结合。
不过,一开始是考虑ember js,不喜欢谷歌学术化的东西。只是ember js的体积暂时让我失去了兴趣。。
D3
D3 是最流行的可视化库之一,它被很多其他的表格插件所使用。它允许绑定任意数据到DOM,然后将数据驱动转换应用到Document中。你可以使用它用一个数组创建基本的HMTL表格,或是利用它的流体过度和交互,用相似的数据创建惊人的SVG条形图。
Bootstrap
Bootstrap是Twitter推出的一个用于前端开发的开源工具包。它由Twitter的设计师Mark Otto和Jacob Thornton合作开发,是一个CSS/HTML框架。
一个又一个的开源组合起来,形成了巨大的优势。就是对热门的技术感兴趣。。。(转载自Phodal's Blog)
创建RESTful
这个也就是由Lavarel来完成了。
php artisan migrate:make create_athomes_table打开对就的table进行修改,代码大致如下
- <?php
- use Illuminate\Database\Schema\Blueprint;
- use Illuminate\Database\Migrations\Migration;
- class CreateAthomesTable extends Migration {
- /**
- * Run the migrations.
- *
- * @return void
- */
- public function up()
- {
- Schema::create('athomes', function(Blueprint $table)
- {
- $table->increments('id');
- $table->float('temperature');
- $table->float('sensors1');
- $table->float('sensors2');
- $table->boolean('led1');
- $table->timestamps();
- });
- }
- /**
- * Reverse the migrations.
- *
- * @return void
- */
- public function down()
- {
- Schema::drop('athomes');
- }
- }
还需要在models下添加一个class
- <?php
- class Athomes extends Eloquent {
- protected $table = 'athomes';
- }
添加到routes.php
- Route::get('/athome/{atid}',function($atid){
- $atdata=Athomes::where('id','=',$atid)
- ->select('id','temperature','sensors1','sensors2','led1')
- ->get();
- return Response::json($atdata);
- });
再为其创建一个页面
- Route::get('/athome',function(){
- $maxid=Athomes::max('id');
- return View::make('athome')->with('maxid',$maxid);
- });
添加两个seeds
- class AthomesTableSeeder extends Seeder
- {
- public function run()
- {
- Athomes::create(array(
- 'temperature'=>'19.8',
- 'sensors1'=>'22.2',
- 'sensors2'=>'7.5',
- 'led1'=>False
- ));
- Athomes::create(array(
- 'temperature'=>'18.8',
- 'sensors1'=>'22.0',
- 'sensors2'=>'7.6',
- 'led1'=>False
- ));
- }
- }
然后,
- php artisan migrate
- php artisan db:seed
这样我们就完成了REST的创建
打开/athome/1看有没有出现相应的json数据
添加Angularjs
开始之前我们需要修改angularjs,默认的{{我选择了喜欢的<%,修改代码如下
- var myApp = angular.module('myApp', [], function($interpolateProvider) {
- $interpolateProvider.startSymbol('<%');
- $interpolateProvider.endSymbol('%>');
- });
让我们用一个简单的例子来测试下是否工作。
- function FetchCtrl($scope, $http, $templateCache) {
- $scope.method = 'GET';
- $scope.url = '<?= url('/athome/1') ?>';
- $scope.code = null;
- $scope.response = null;
-
- $http({method: $scope.method, url: $scope.url, cache: $templateCache}).
- success(function(data, status) {
- $scope.status = status;
- $scope.data = data;
- $.each(data,function(key,val){
- sensorsData.push(val.sensors1);
- })
- }).
- error(function(data, status) {
- $scope.data = data || "Request failed";
- $scope.status = status;
- log.l("Request Failed");
- });
- }
HTML代码
- <div id="App1" ng-app="myApp" ng-controller="FetchCtrl">
- <pre>http status code: <%status%></pre>
- <pre>http response data: <%data%></pre>
- </div>
angular.bootstrap(document.getElementById("App2"),['chartApp']);
那么效果应该如下所示:
http status code: 200
http response data: [{"id":1,"temperature":19.799999237061,"sensors1":22.200000762939,"sensors2":7.5,"led1":0}]或如下图所示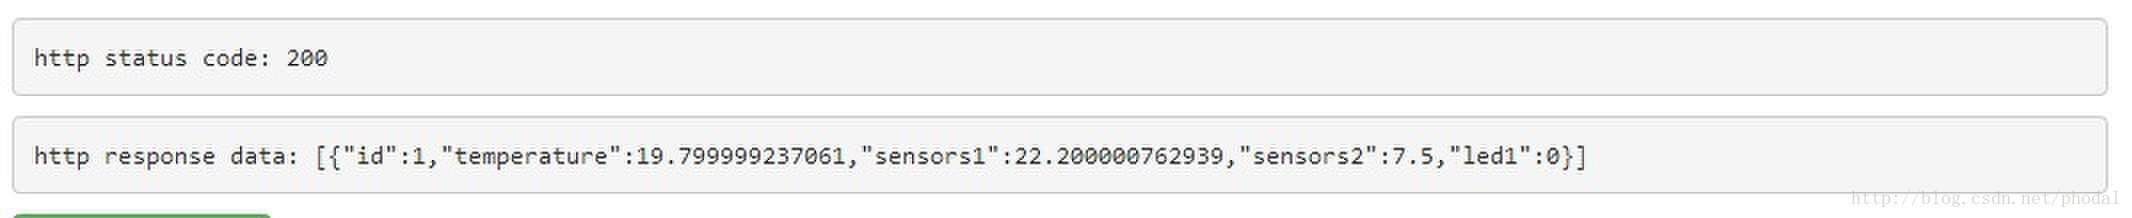
D3
- var app = angular.module('chartApp', ['n3-charts.linechart']);
- app.controller('MainCtrl', function($scope, $http, $templateCache) {
- $scope.click=function(){
- $scope.options = {lineMode: 'cardinal',series: [{y: 'value', label: '温度', color: 'steelblue'}]};
- $scope.data=[{x:0,value:12}];
- $scope.url = '<?= url('/athome') ?>';
- $scope.url=$scope.url+'/'+{{$maxid}};
- log.l($scope.url);
- $scope.method = 'GET';
-
- $http({method: $scope.method, url: $scope.url, cache: $templateCache}).
- success(function(data, status) {
- $.each(data,function(key,val){
- $scope.data.push({x:1,value:val.sensors1});
- $scope.data.push({x:2,value:val.sensors2});
- log.l($scope.data);
- })
- }).
- error(function(data, status) {
- $scope.data = data || "Request failed";
- log.l("Request Failed");
- });
- }
- });
HTML代码如下:
- <div id="App2" ng-controller="MainCtrl">
- <button ng-click="click()" class="btn btn-success"><span class="glyphicon glyphicon-refresh"></span> Star
- 获取数据</button>
- <linechart data='data' options='options'></linechart>
- </div>
补充:里面使用了bootstrap框架