You are here
马哥 48_03 _CPU负载观察及调优方法 有大用
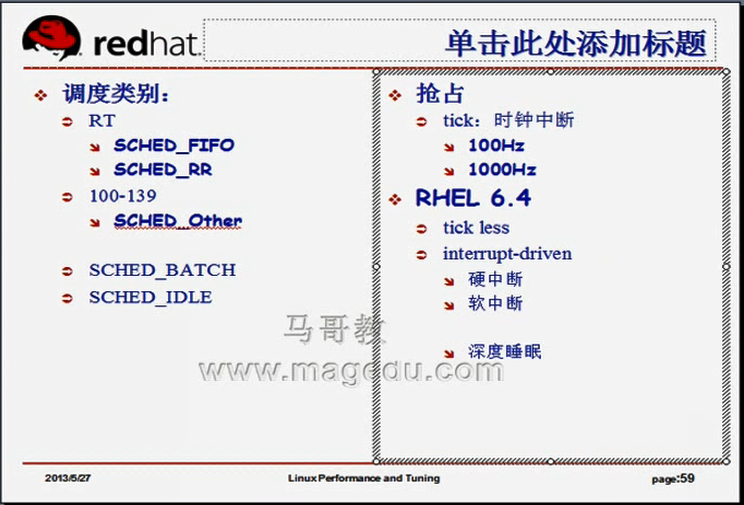
内核的调度类别
三个调度器分别用来调度不同优先级的进程,不同类的进程
实时进程:调度器有两个
SCHED_FIFO: scheduler first in first out,调度先进先出,先运行完了,其它进程才能运行,调度方法很粗糙
SCHED_RR: scheduler Round Bobin 调度是轮调的,每个进程有时间片,就算是实时的?????,优先级一样,时间片运行完了,就换同级别的下一个,
SCHED_OTHER: (linux中)scheduler other 调度其它的,调度用户空间(100-139之间的)进程的,,,, 在unix (SCHED_NORMAL),,,, 未必调度的都是用户空间的线程,用来调度100-139之间的优先级的进程,,按优先级进行调度
SCHED_BATCH #红帽6上 #调整批处理进程类别????
SCHED_IDLE #红帽6上 #调整空闲进程类别????
如下图
linux支持进程抢占的,tick(嘀嗒):时间中断时才能抢,内核工作在一定的频率下(100Hz,256Hz,1000Hz等)(赫兹越高,时钟频率精度越高,解析度越高,计时的精度也会越高,)(频率越高,进程抢占的机会越多,进程切换的可能性也会越多,,如果cpu足够快,,,,嘀嗒快无所谓,但是经过验证发现,嘀嗒快了,性能未必好,太快的嘀嗒会导致切换的太快,导致运行了一刻,就又下来了)(红帽内核,早期100Hz,后来1000Hz,现在又回到100Hz)
红帽6.4实现了无嘀嗒的系统,,,,如果有嘀嗒的话,如果100Hz的话,则有100次中断,(空闲时空消耗资源,cpu空转),,,
无嘀嗒的话,cpu可以深度睡眠,,要依赖于中断进行驱动了,,,系统可节约电源,还可以不致于空载而发热量过高等优点
tick less,
interrupt-driven
分为 硬中断 hardirq
软中断 softirq (系统调用的时候,需要从用户模式切换到内核模式,可以理解为软中断)
如下图
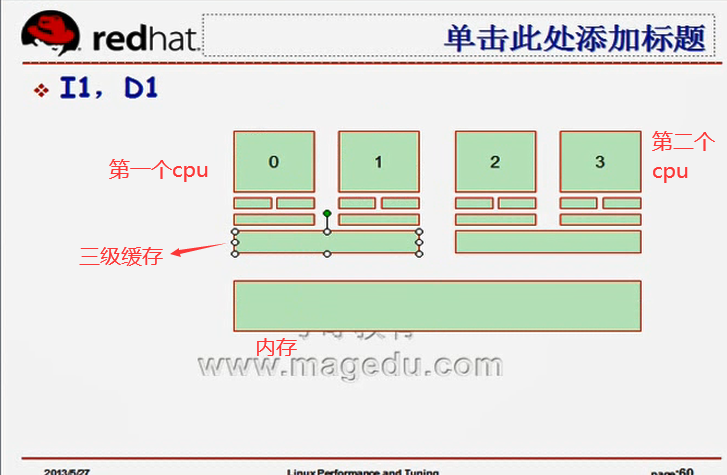
cpu现在一般多核,每个核都有一级缓存,二级缓存,三级缓存
I1: instructions 1 ,一级指令缓存
D1: Data 1,一级数据缓存
L2: 二级缓存,level 水平等级的意思,,,,有时也叫D2吧,Data 2的意思,应该二级缓存只有数据缓存,没有指令的缓存吧
一级缓存,二级缓存是cpu核独有的,三级缓存是cpu核共享的

SMP: 对称多处理"(Symmetrical Multi-Processing),,,,多cpu,不一定多核心,
如下图
一块主板四个cpu插槽,(每一个插槽称为socket),如果每颗插槽上插一个四核的cpu,,,四个cpu访问的是同一个物理内存,会产生资源竞争,有临界区???? 我们要解决仲裁机制,,,,一个cpu访问内存的时候,时钟周期有三个,(第一,向内存控制传递一个寻址要求,由内存控制器向cpu返回寻址指令,第二,cpu找到存储单元,cpu访问内存,访问时需要施加锁,即施加一定的请求机制,对内存的访问也有读写两种模式,第三,cpu完成读或写的操作,,,,,,,,,,,,,当第一个cpu与内存控制器打交道时,第二个cpu就不能了,,因为内存控制器是一个临界区?????
在对称多处理器模型当中,因为内存节点(把一个内存称为一个节点)只有一个,使得性能的提升有限,一般随着cpu颗数的增多,性能成抛物线的趋势,,,为什么cpu颗数增太多时,性能会下降,是因为内存资源的争用,当然也可能是内存总线的速度受影响

如下图,
双核时(多核时),三级缓存也是资源争用区,但三级缓存比内存快得多,,,,它在同一个socket上,

如下图
如果两颗cpu,每颗cpu都有自己独有的内存访问区域,第一个cpu中含有cpu0,cpu1,第二个cpu中含有cpu2,cpu3,,,,, cpu0,cpu1对三级缓存的访问速度肯定比对内存快很多,同时又因为速度快,所以cpu0,cpu1因为对三级缓存的争用比较小,
如下图
假设单核cpu,不考虑三级缓存了,第一个cpu(cpu0)有自己单独的内存控制器和专用的内存,,,,第二个cpu(cpu1)有自己单独的内存控制器和专用的内存,,,,,, 因为内存是系统级别的,所以内核装载数据的时候,内存任何一处都可以装载,,,第一个cpu(cpu0)访问的数据,可能在一级缓存或二级缓存或自己这边的内存,也可能在另外一个内存当中,

如下图
有了两个cpu,进程调度就不是一个队列了,每颗cpu都有自己的队列,队列会不断的被内核所平衡,,,,假设共200个进程,第一个cpu(cpu0)运行了100个,第二个cpu(cpu1)也运行了100个,,,,过一段时间,第一个cpu(cpu0)上90个进程运行完了,,,,第二个cpu(cpu1)上只有10个进程运行完了,,,,,,,,,,,,,此时第一个cpu(cpu0)上还剩10个进程,第二个cpu(cpu1)上还剩90个进程,,,,为了防止有的cpu忙,有的cpu闲,,我们内核此时会重新rebalance,rebalancing,,,,比如此时从第二个cpu(cpu1)上划分出40个给第一个cpu(cpu0),,,,,那么 此时第一个cpu(cpu0)上还剩50个进程,第二个cpu(cpu0)上还剩50个进程,,,,,划分给第一个cpu(cpu0)的40个进程在右边的1段内存段中,所以此时第一个cpu(cpu0)要到右边的1段内存段中去找数据,,即访问另外一个cpu的专用内存
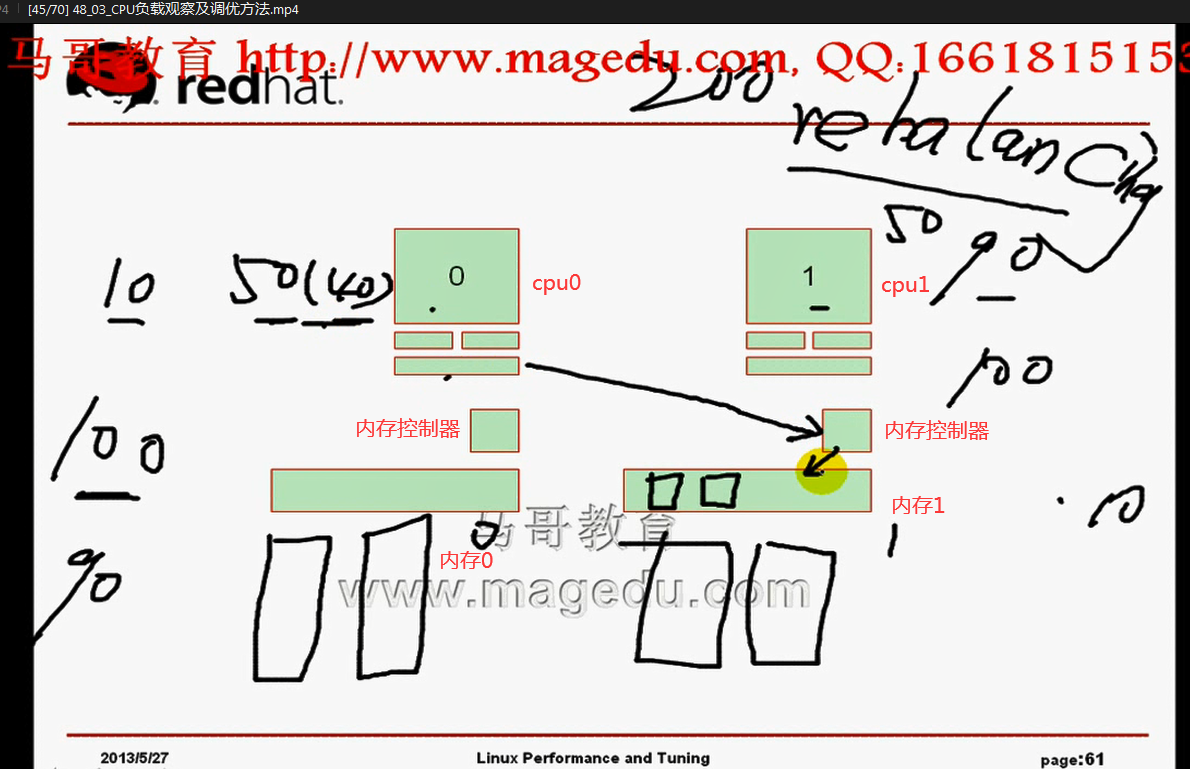
cpu自己专用内存,并不是别人不能用,而是说这是自己这个cpu的主要访问区域,对其它的cpu来说是次要访问区域,
如下图,
第一个cpu(cpu0)访问自己的内存控制器,比到对方的内存控制器距离短,速度快,,,
每一个cpu都有有自己的内存控制器,我们称为非一致性内存访问NUMA
NUMA: Non-uniform Memory Architecture 非一致性内存架构;非一致性内存架构(Non-uniform Memory Architecture)是为了解决传统的对称多处理(SMP Symmetric Multi-processor)系统中的可扩展性问题而诞生的。 Non-uniform Memory Access (非一致性内存访问)

SMP内存是共享的,
如下图,NUMA下每一个cpu都有自己的内存,而且每个内存都有自己的内存控制器,内存控制器很可能在cpu内部,而且内存离当前cpu非常近,所以内存与socket的关联性非常大,而且cpu到自己内存的总线速度非常高,,,cpu假如访问对方的内存控制器,这中间要跨越cpu插槽,此时要经过一个外部的总线才能过去,,,,cpu到对方的内存控制器,与到自己的内存控制器,时间相差很多,,,一个cpu访问自己的内存,只需要3个时钟周期,而访问对方的内存,至少需要6个时间周期(cpu先到自己的内存控制器,自己的内存控制器再去请求对方的内存控制器)
第一个cpu(cpu0)访问自己的内存要三步,3个时钟周期,
第一个cpu(cpu0)访问别人的内存要四步,其中1a这一步就要3个时钟周期,共6个时钟周期
我们可以把左边的cpu+内存控制器+内存称为一个node节点,,,右边也称为一个节点
左边 cpu0-3,是四核的cpu(cpu0,cpu1,cpu2,cpu3)(如果是超线程的话,显示为8个核心的)

NUMA结构上,尽可能让cpu只访问自己的内存,,,因为内核要尽可能的平衡进程,所以进程常常在两个cpu之间转换,,所以就会发生cpu进行交叉内存访问了,,所以性能下降在所难免了,,所以我们要禁止内核给它重新平衡
对于很繁忙的进程,我们使用cpu_affinity,即cpu绑定(cpu的密切关系,姻亲关系),将某些经常运行的批处理进程或服务进程,启动起来以后,直接绑定在某颗cpu上(或cpu上的某颗核心上),,,,,所以它只能在这颗cpu上运行,从而它再也不会被调用到其它cpu上面去,从而不会交叉内存访问了
有时平衡cpu的访问仍有必要,因为不平衡的一颗cpu忙,另一颗cpu闲,那么性能仍然是下降的,
在NUMA结构上,内存本身的命中次数非常少的时候,要不要平衡cpu???要不要绑定????
[root@localhost ~]# numa #按tab键 , 相关命令四个
numactl numad numademo numastat
[root@localhost ~]#
numactl 控制命令
numastat 显示状态命令
numad 服务进程
numademo 演示示例
[root@localhost ~]# numastat #好像 32位不行,必须要64的才位,反正 64位的红帽6 是行的
sysfs not mounted or system not NUMA aware: No such file or directory
[root@localhost ~]#
装一下 64位的红帽6,下面的操作就是在64位的红帽6下进行的
[root@localhost ~]# numastat #这是SMP
node0 #如果有多个node,支持非对称性(NUMA)的转换????,这里可能有n个node???????
numa_hit 1327673 #cpu命中内存的数据的个数
numa_miss 0 #NUMA的情况下,cpu未命中内存的数据的个数 什么时候需要绑定进程到cpu???numa_miss量过高的时候,就需要绑定了????numa_miss有很高的值,表示在本地找数据,总是找不着的时候, 可能cpu重新平衡进程的次数太多了,此时就需要将某个进程(要观察一下,看哪个进程是服务进程,而且经常会被重新平衡的)绑定在某个特定的cpu上,(如果是个nginx服务器的话,将nginx的某些进程直接跟cpu关联,从而使得本地的命中率很高)
numa_foreign 0
interleave_hit 21013
local_node 1327673
other_node 0
[root@localhost ~]#
[root@localhost ~]# man numastat
Cannot open the message catalog "man" for locale "zh_CN.UTF-8"
(NLSPATH="/usr/share/locale/%l/LC_MESSAGES/%N")
Formatting page, please wait...
numastat(8) Administration numastat(8)
numastat
numastat - Show per-NUMA-node memory statistics for processes and the
operating system
SYNTAX
numastat
numastat [-V]
numastat [<PID>|<pattern>...]
numastat [-c] [-m] [-n] [-p <PID>|<pattern>] [-s[<node>]] [-v] [-z]
[<PID>|<pattern>...]
DESCRIPTION
numastat with no command options or arguments at all, displays per-node
NUMA hit and miss system statistics from the kernel memory allocator.
This default numastat behavior is strictly compatible with the previous
long-standing numastat perl script, written by Andi Kleen. The default
numastat statistics shows per-node numbers (in units of pages of mem-
ory) in these categories:
numa_hit is memory successfully allocated on this node as intended. #命中率
numa_miss is memory allocated on this node despite the process prefer- #未命中率
ring some different node. Each numa_miss has a numa_foreign on another
node.
numa_foreign is memory intended for this node, but actually allocated
on some different node. Each numa_foreign has a numa_miss on another
node. #本来分配给自己使用的,但是被分配给非本地cpu使用了
interleave_hit is interleaved memory successfully allocated on this
node as intended. #不用关心
local_node is memory allocated on this node while a process was running
on it.
other_node is memory allocated on this node while a process was running
on some other node.
Any supplied options or arguments with the numastat command will sig-
nificantly change both the content and the format of the display.
Specified options will cause display units to change to megabytes of
memory, and will change other specific behaviors of numastat as
described below.
OPTIONS
-c Minimize table display width by dynamically shrinking column
widths based on data contents. With this option, amounts of
memory will be rounded to the nearest megabyte (rather than the
usual display with two decimal places). Column width and inter-
column spacing will be somewhat unpredictable with this option,
but the more dense display will be very useful on systems with
many NUMA nodes.
-m Show the meminfo-like system-wide memory usage information.
This option produces a per-node breakdown of memory usage infor-
mation similar to that found in /proc/meminfo.
-n Show the original numastat statistics info. This will show the
same information as the default numastat behavior but the units
will be megabytes of memory, and there will be other formatting
and layout changes versus the original numastat behavior.
-p <PID> or <pattern>#查看每一个特定进程的内存分配,如果某一个进程的内存分配跨越了多个node,意味着我们应该进行绑定
Show per-node memory allocation information for the specified
PID or pattern. If the -p argument is only digits, it is
assumed to be a numerical PID. If the argument characters are
not only digits, it is assumed to be a text fragment pattern to
search for in process command lines. For example, numastat -p
qemu will attempt to find and show information for processes
with "qemu" in the command line. Any command line arguments
remaining after numastat option flag processing is completed,
are assumed to be additional <PID> or <pattern> process speci-
fiers. In this sense, the -p option flag is optional: numastat
qemu is equivalent to numastat -p qemu
-s[<node>] #查看 show 某一个node的,有排序的作用
Sort the table data in descending order before displaying it, so
the biggest memory consumers are listed first. With no speci-
fied <node>, the table will be sorted by the total column. If
the optional <node> argument is supplied, the data will be
sorted by the <node> column. Note that <node> must follow the
-s immediately with no intermediate white space (e.g., numastat
-s2). Because -s can allow an optional argument, it must always
be the last option character in a compound option character
string. For example, instead of numastat -msc (which probably
will not work as you expect), use numastat -mcs
-v Make some reports more verbose. In particular, process informa-
tion for multiple processes will display detailed information
for each process. Normally when per-node information for multi-
ple processes is displayed, only the total lines are shown.
-V Display numastat version information and exit.
-z Skip display of table rows and columns of only zero valuess.
This can be used to greatly reduce the amount of uninteresting
zero data on systems with many NUMA nodes. Note that when rows
or columns of zeros are still displayed with this option, that
probably means there is at least one value in the row or column
that is actually non-zero, but rounded to zero for display.
[root@localhost ~]# numastat -s #显示所有node
Per-node numastat info (in MBs):
Node 0 Total
--------------- ---------------
Numa_Hit 5229.84 5229.84
Local_Node 5229.84 5229.84
Interleave_Hit 82.08 82.08
Numa_Foreign 0.00 0.00
Numa_Miss 0.00 0.00
Other_Node 0.00 0.00
[root@localhost ~]#
[root@localhost ~]# numastat -s node0 #只显示node0和Total
Found no processes containing pattern: "node0"
Per-node numastat info (in MBs):
Node 0 Total
--------------- ---------------
Numa_Hit 5232.39 5232.39
Local_Node 5232.39 5232.39
Interleave_Hit 82.08 82.08
Numa_Foreign 0.00 0.00
Numa_Miss 0.00 0.00
Other_Node 0.00 0.00
[root@localhost ~]#
[root@localhost ~]# man numactl
Cannot open the message catalog "man" for locale "zh_CN.UTF-8"
(NLSPATH="/usr/share/locale/%l/LC_MESSAGES/%N")
Formatting page, please wait...
NUMACTL(8) Linux Administrator’s Manual NUMACTL(8)
NAME
numactl - Control NUMA policy for processes or shared memory #实现numa策略控制的
SYNOPSIS
numactl [ --all ] [ --interleave nodes ] [ --preferred node ] [ --mem-
bind nodes ] [ --cpunodebind nodes ] [ --physcpubind cpus ] [
--localalloc ] [--] command {arguments ...}
numactl --show
numactl --hardware
numactl [ --huge ] [ --offset offset ] [ --shmmode shmmode ] [ --length
length ] [ --strict ]
[ --shmid id ] --shm shmkeyfile | --file tmpfsfile
[ --touch ] [ --dump ] [ --dump-nodes ] memory policy
DESCRIPTION
numactl runs processes with a specific NUMA scheduling or memory place-
ment policy. The policy is set for command and inherited by all of its
children. In addition it can set persistent policy for shared memory
segments or files.
Use -- before command if using command options that could be confused
with numactl options.
nodes may be specified as N,N,N or N-N or N,N-N or N-N,N-N and so
forth. Relative nodes may be specifed as +N,N,N or +N-N or +N,N-N and
so forth. The + indicates that the node numbers are relative to the
process’ set of allowed nodes in its current cpuset. A !N-N notation
indicates the inverse of N-N, in other words all nodes except N-N. If
used with + notation, specify !+N-N. When same is specified the previ-
ous nodemask specified on the command line is used. all means all
nodes in the current cpuset.
Instead of a number a node can also be:
netdev:DEV The node connected to network device DEV.
file:PATH The node the block device of PATH.
ip:HOST The node of the network device of HOST
block:PATH The node of block device PATH
pci:[seg:]bus:dev[:func] The node of a PCI device.
Note that block resolves the kernel block device names only for udev
names in /dev use file:
Policy settings are:
--all, -a
Unset default cpuset awareness, so user can use all possible
CPUs/nodes for following policy settings.
--interleave=nodes, -i nodes
Set a memory interleave policy. Memory will be allocated using
round robin on nodes. When memory cannot be allocated on the
current interleave target fall back to other nodes. Multiple
nodes may be specified on --interleave, --membind and --cpunode-
bind.
--membind=nodes, -m nodes
Only allocate memory from nodes. Allocation will fail when
there is not enough memory available on these nodes. nodes may
be specified as noted above.
--cpunodebind=nodes, -N nodes # cpu node bind,只将命令运行在cpu自己所属的node上,,即将cpu与node完成了绑定,不让cpu访问其它node了,,,在某个进程运行的时候,让某颗cpu必须要访问自己的node,,,不访问其它node有什么缺陷???假如说cpu找数据,自己内存中没有,不找别人的内存了,就直接从硬盘加载了,,,如果其它内存中有数据,也用不上了,,,长久以后,就保证了,每一个进程的数据就只在当前cpu node所在的那个内存里了
Only execute command on the CPUs of nodes. Note that nodes may
consist of multiple CPUs. nodes may be specified as noted
above.
--physcpubind=cpus, -C cpus #Physicals cpu bind,物理的cpu绑定,,就是将进程与cpu绑定,
Only execute process on cpus. This accepts cpu numbers as shown
in the processor fields of /proc/cpuinfo, or relative cpus as in
relative to the current cpuset. You may specify "all", which
means all cpus in the current cpuset. Physical cpus may be
specified as N,N,N or N-N or N,N-N or N-N,N-N and so forth.
Relative cpus may be specifed as +N,N,N or +N-N or +N,N-N and
so forth. The + indicates that the cpu numbers are relative to
the process’ set of allowed cpus in its current cpuset. A !N-N
notation indicates the inverse of N-N, in other words all cpus
except N-N. If used with + notation, specify !+N-N.
--localalloc, -l
Falls back to the system default which is local allocation by
using MPOL_DEFAULT policy. See mbind(2) for details.
--preferred=node
Preferably allocate memory on node, but if memory cannot be
allocated there fall back to other nodes. This option takes
only a single node number. Relative notation may be used.
--show, -s #也可以显示当前进程运行的设定
Show NUMA policy settings of the current process.
--hardware, -H
Show inventory of available nodes on the system.
Numactl can set up policy for a SYSV shared memory segment or a file in
shmfs/hugetlbfs.
This policy is persistent and will be used by all mappings from that
shared memory. The order of options matters here. The specification
must at least include either of --shm, --shmid, --file to specify the
shared memory segment or file and a memory policy like described above
( --interleave, --localalloc, --preferred, --membind ).
--huge
When creating a SYSV shared memory segment use huge pages. Only valid
before --shmid or --shm
--offset
Specify offset into the shared memory segment. Default 0. Valid units
are m (for MB), g (for GB), k (for KB), otherwise it specifies bytes.
--strict
Give an error when a page in the policied area in the shared memory
segment already was faulted in with a conflicting policy. Default is to
silently ignore this.
--shmmode shmmode
Only valid before --shmid or --shm When creating a shared memory seg-
ment set it to numeric mode shmmode.
--length length
Apply policy to length range in the shared memory segment or make the
segment length long Default is to use the remaining length Required
when a shared memory segment is created and specifies the length of the
new segment then. Valid units are m (for MB), g (for GB), k (for KB),
otherwise it specifies bytes.
--shmid id
Create or use an shared memory segment with numeric ID id
--shm shmkeyfile
Create or use an shared memory segment, with the ID generated using
ftok(3) from shmkeyfile
--file tmpfsfile
Set policy for a file in tmpfs or hugetlbfs
--touch
Touch pages to enforce policy early. Default is to not touch them, the
policy is applied when an applications maps and accesses a page.
--dump
Dump policy in the specified range.
--dump-nodes
Dump all nodes of the specific range (very verbose!)
Valid node specifiers
all All nodes
number Node number
number1{,number2} Node number1 and Node number2
number1-number2 Nodes from number1 to number2
! nodes Invert selection of the following specification.
[root@localhost ~]# numactl --show #也能够显示策略
policy: default
preferred node: current
physcpubind: 0 1 2 3 4 5 6 7 # 所有的进程绑定到这八个cpu核心上,,其实也就是没有绑定吧
cpubind: 0 #cpu没绑定,cpu绑定在0 节点上,啥意思????
nodebind: 0 #node绑定在0 节点上
membind: 0 #mem绑定在0 节点上
[root@localhost ~]#
[root@localhost ~]# cat /proc/cpuinfo | grep processor #八核
processor : 0
processor : 1
processor : 2
processor : 3
processor : 4
processor : 5
processor : 6
processor : 7
[root@localhost ~]#
[root@localhost ~]# cat /proc/cpuinfo | grep "physical id" #两颗cpu
physical id : 0
physical id : 0
physical id : 0
physical id : 0
physical id : 1
physical id : 1
physical id : 1
physical id : 1
[root@localhost ~]#
numa调整完后,重启,就失效了, 因为是用命令强行将进程绑定的,
numad 是服务,这样重启电脑时,重启这个服务,就能长久的起作用了
[root@localhost ~]# man numad
Cannot open the message catalog "man" for locale "zh_CN.UTF-8"
(NLSPATH="/usr/share/locale/%l/LC_MESSAGES/%N")
Formatting page, please wait...
numad(8) Administration numad(8)
NAME
numad - A user-level daemon that provides placement advice and process
management for efficient use of CPUs and memory on systems with NUMA
topology. #用户级别的守护进程能够提供自我启发式的策略,能够通过观察cpu上的每一个进程的运行状况,自动的将某个进程给它关联到某cpu上,将某个cpu关联到某个node上;;;;;自我监控,并完成自我优化和管理,,,,,,如果是numa架构的话,可以启动 numad 服务,,,这个进程本身也可以在启动的时候限定只让它监控某些进程,而不是所有进程,,,,并且在必要的时候,还可以将它停下来,,,它可以指定多长时间观察一次,最长多久观察一次,最短多久观察一次,,,,观察级别,调整级别,,,,,,,有人做过测试,在一个非常繁忙的服务器中,假如说需要重新平衡的场景当中,启动numad这个进程,可以让性能提高50%左右,前提是 # numastat 命令检查一下,看miss量是不是很高,,, 将来很可能要用到
SYNOPSIS
numad [-dhvV]
numad [-C 0|1]
numad [-H THP_hugepage_scan_sleep_ms]
numad [-i [min_interval:]max_interval]
numad [-K 0|1]
numad [-l log_level]
numad [-m target_memory_locality]
numad [-p PID]
三个命令
numastat
numactl
numad #可以使用 service numad start 等,,,可以使用# chkconfig on 这些命令的
numad只是在硬件级别将某个进程(某些进程)跟我们的cpu和node绑定的, 真想建立cpu affinity(cpu姻亲关系),得实现将进程跟cpu绑定,,,,,,我们有专门的工具,就算是非numa架构的,我们也可以实现专门将某个进程跟cpu进行绑定,也有专门的命令,叫taskset
taskset:主要功能就是绑定进程至某cpu,
它以mask掩码的方式来引用cpu,用16进制来表示
0x0000 0001 换成二进制 0001 表示0号 cpu 对应的上面有1,表示有那颗cpu
0x0000 0003 换成二进制 0011 表示0号 cpu 和 1号 cpu 对应的上面有1,表示有那两颗cpu
0x0000 0005 换成二进制 0101 表示0号 cpu 和 2号 cpu 对应的上面有1,表示有那两颗cpu
0x0000 0007 换成二进制 0111 表示0号 cpu 和 1号 cpu 和 2号 cpu (即0-2号)对应的上面有1,表示有那三颗cpu
# taskset -p mask pid #绑定某个进程到某个cpu
# taskset -p 0x00000004 101 #将101号进程绑定在3号cpu ( 0x00000004的二进制是 0100 即3号)上
# taskset -p 0x00000003 101 #将101号进程绑定在0号和1号 cpu ( 0x00000003的二进制是 0011 即0号和1号)上
# taskset -p -c 3 101 #将101号进程绑定在3号cpu,不需要做掩码转换了
# taskset -p -c 0,1 101 #将101号进程绑定在0号和1号 cpu
# taskset -p -c 0-2 101 #将101号进程绑定在0号,1号,2号 cpu
# taskset -p -c 0-2,7 101 #将101号进程绑定在0号,1号,2号,7号 cpu
服务器很少关机,所以手动绑一下没关系,,但是重启后要重新绑了,,,这些命令可以写成脚本定义好,但是下次重新启动时,进程号会不一样的,,,,,,所以nginx直接在配置文件中绑定 nginx的 work affinity 明确说明每一个work分别绑定在哪一号cpu上,,此时的cpu的表示方式与taskset的0x是类似的
[root@localhost ~]# man taskset
Cannot open the message catalog "man" for locale "zh_CN.UTF-8"
(NLSPATH="/usr/share/locale/%l/LC_MESSAGES/%N")
Formatting page, please wait...
TASKSET(1) Linux User’s Manual TASKSET(1)
NAME
taskset - retrieve or set a process’s CPU affinity
SYNOPSIS
taskset [options] mask command [arg]...
taskset [options] -p [mask] pid
DESCRIPTION
taskset is used to set or retrieve the CPU affinity of a running pro-
cess given its PID or to launch a new COMMAND with a given CPU affin-
ity. CPU affinity is a scheduler property that "bonds" a process to a
given set of CPUs on the system. The Linux scheduler will honor the
given CPU affinity and the process will not run on any other CPUs.
Note that the Linux scheduler also supports natural CPU affinity: the
scheduler attempts to keep processes on the same CPU as long as practi-
cal for performance reasons. Therefore, forcing a specific CPU affin-
ity is useful only in certain applications.
The CPU affinity is represented as a bitmask, with the lowest order bit
corresponding to the first logical CPU and the highest order bit corre-
sponding to the last logical CPU. Not all CPUs may exist on a given
system but a mask may specify more CPUs than are present. A retrieved
mask will reflect only the bits that correspond to CPUs physically on
the system. If an invalid mask is given (i.e., one that corresponds to
no valid CPUs on the current system) an error is returned. The masks
are typically given in hexadecimal. For example,
0x00000001 # 这是16进制 这是cpu0
is processor #0
0x00000003 # 这是16进制.转为二进制 00000011
is processors #0 and #1
0xFFFFFFFF
is all processors (#0 through #31)
When taskset returns, it is guaranteed that the given program has been
scheduled to a legal CPU.
OPTIONS
-p, --pid
operate on an existing PID and not launch a new task
-c, --cpu-list #明确指定第几号cpu
specify a numerical list of processors instead of a bitmask.
The list may contain multiple items, separated by comma, and
ranges. For example, 0,5,7,9-11.
-h, --help
display usage information and exit
-V, --version
output version information and exit
如下图
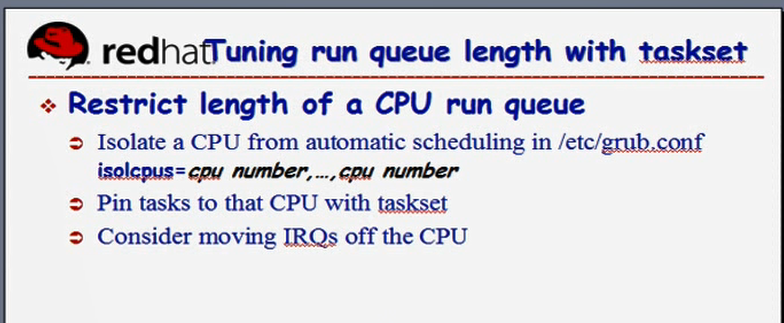
就算使用了taskset 的方式绑定了某进程到某号cpu上,但是cpu还运行其它进程,其它进程有可能会被调到这个cpu上的,仍然有可能切换,,,,,假设当前主机有16核,留下两核供系统所有,剩下14核心专门用来运行某些进程,再也不切换了,,,只不过我们要把这些cpu核心从所有进程中隔离出来,,,,,由此启动电脑的时候,在/etc/grub.conf里面传递一个参数, isolcpus ( isolate cpus 隔离cpu),将这些cpu从操作系统中隔离出来,意味着系统启动起来以后,内核不会让已经启动的进程使用这些cpu的,而后使用taskset命令 pin 某个(某些)任务,某个(某些)任务钉在某个cpu上去了,,,这仍然不能保证,cpu只服务于这个进程,,,因为服务器还得服务于中断的(进程正在这个cpu上运行着,突然间其它硬件发来一个中断,意味着cpu必须要停下来转换为内核模式处理中断了),,,我们还可以为将这个cpu上的中断处理程序通通移走,隔离中断,不再处理任何中断了,,,从此以后这个cpu要么运行这个进程,要么运行内核?????....甚至隔离出来之后,内核也不在这个cpu上运行了,从此以后就直接绑定这一个进程了,再也不切换了,,,,当它需要跟内核进行交互的时候,内核需要调度到其它cpu上去执行,但是一般来讲,内核还是可以在当前cpu上执行的,,,,,,,,因为在同一颗cpu上,我们应该完成模式切换
如下图
我们来看如何实现完成smp的affinity,或者说完成将某个cpu的mask跟某个进程(某个中断???)进行绑定
<irq_num>中断号,中断线

[root@localhost ~]# cat /proc/irq/ #按tab键
0/ 29/ 45/
1/ 3/ 46/
10/ 30/ 47/
11/ 31/ 48/
12/ 32/ 49/
13/ 33/ 5/
14/ 34/ 50/
15/ 35/ 51/
16/ 36/ 52/
17/ 37/ 53/
18/ 38/ 54/
19/ 39/ 55/
2/ 4/ 6/
24/ 40/ 7/
25/ 41/ 8/
26/ 42/ 9/
27/ 43/ default_smp_affinity
28/ 44/
[root@localhost ~]# cat /proc/irq/0/smp_affinity #一大堆f,表示0号中断线可以运行在所有cpu上,,ffffffff表示任意cpu,我们可以将这个中断线绑定到某个cpu上,
ffffffff
下面马哥的,比我多出 ,ffffffff

[root@localhost ~]#
如下图,
我们一共16核,我们期望我们的系统只运行在0核和1核上,剩下的14核(从2-15)都要隔离出来了,我们将中断只绑定在0和1上,2-15不处理中断了,,,,,echo cpu_mask(cpu的掩码比如 0x000000001 (0001??),0x000000010(0002)),,,,因此我们将第0个(及第1,2,3个)中断绑定到0号cpu,将第4个(及第5,6,7个)中断绑定到1号cpu,,,,这样一来,将所有的中断就绑定到这两个特定的cpu上,第2-15个cpu就不用处理中断了,,,,所以从此就实现了,将某一个(某些个)cpu从中断处理中隔离了出来,,,,,,这种绑定,是把它们绑定在我们不打算隔离出来的cpu上,

应该将中断绑定至那些非隔离的CPU上,从而避免那些隔离的CPU处理中断程序,
<irq number> 就是某一个中断号码
echo CPU_MASK > /proc/irq/<irq number>/smp_affinity
什么时候需要绑定中断,什么时候需要将进程绑定在cpu上,numa场景当中,命中率很低的时候,需要绑定,,,,非numa场景当中,
如果不绑定,进程需要在各个cpu之间来回进行切换,切换率过高,,,非常重要的服务老是被切换出去,会导致用户响应速度慢,,,,,,cpu核心数非常多,而某一个服务非常繁忙,我们期望它特定的在某颗cpu上始终处于运行状态,就需要绑定了,,,,,,,,,,,,,,,怎么知道哪个进程非常繁忙,哪个进程上下文切换次数很多,看看下图所说的某些命令吧
如下图
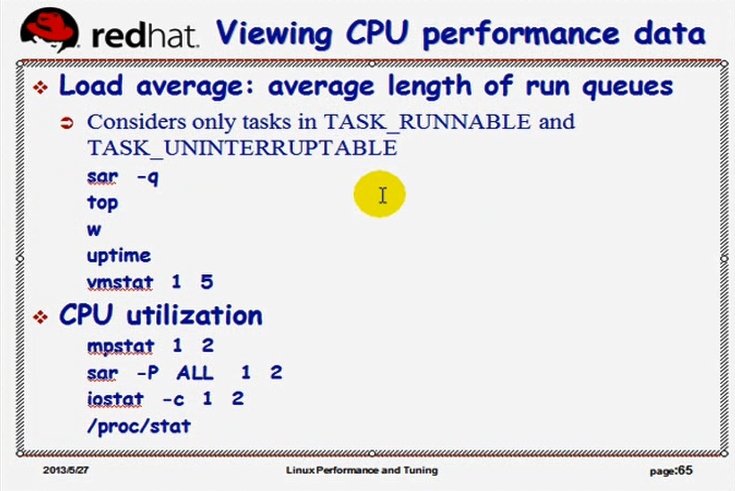
查看cpu活动状态的命令,主要看task_runnable 和 task_uninterruptable的进程,
Load average: 查看cpu的平均利用率的
sar -q: 也能查看cpu的平均利用率的
top: 也可以查看cpu的使用率的
w
uptime
vmstat 1 5
[root@localhost ~]# rpm -qf `which sar` #看看sar是由谁安装的
sysstat-9.0.4-33.el6_9.1.x86_64 #这个包
[root@localhost ~]#
[root@localhost ~]# rpm -ql sysstat
/etc/cron.d/sysstat
/etc/rc.d/init.d/sysstat
/etc/sysconfig/sysstat
/etc/sysconfig/sysstat.ioconf
/usr/bin/cifsiostat
/usr/bin/iostat #命令会用到
/usr/bin/mpstat #命令会用到
/usr/bin/pidstat #命令会用到
/usr/bin/sadf #命令会用到
/usr/bin/sar #命令会用到
/usr/lib64/sa #命令会用到
/usr/lib64/sa/sa1 #命令会用到,生成文件并分析过去的执行状态的
/usr/lib64/sa/sa2 #命令会用到,生成文件并分析过去的执行状态的
/usr/lib64/sa/sadc #命令会用到
/usr/share/doc/sysstat-9.0.4
/usr/share/doc/sysstat-9.0.4/CHANGES
/usr/share/doc/sysstat-9.0.4/COPYING
/usr/share/doc/sysstat-9.0.4/CREDITS
/usr/share/doc/sysstat-9.0.4/FAQ
/usr/share/doc/sysstat-9.0.4/README
/usr/share/doc/sysstat-9.0.4/TODO
/usr/share/locale/af/LC_MESSAGES/sysstat.mo
/usr/share/locale/da/LC_MESSAGES/sysstat.mo
/usr/share/locale/de/LC_MESSAGES/sysstat.mo
/usr/share/locale/es/LC_MESSAGES/sysstat.mo
/usr/share/locale/fi/LC_MESSAGES/sysstat.mo
/usr/share/locale/fr/LC_MESSAGES/sysstat.mo
/usr/share/locale/id/LC_MESSAGES/sysstat.mo
/usr/share/locale/it/LC_MESSAGES/sysstat.mo
/usr/share/locale/ja/LC_MESSAGES/sysstat.mo
/usr/share/locale/ky/LC_MESSAGES/sysstat.mo
/usr/share/locale/lv/LC_MESSAGES/sysstat.mo
/usr/share/locale/mt/LC_MESSAGES/sysstat.mo
/usr/share/locale/nb/LC_MESSAGES/sysstat.mo
/usr/share/locale/nl/LC_MESSAGES/sysstat.mo
/usr/share/locale/nn/LC_MESSAGES/sysstat.mo
/usr/share/locale/pl/LC_MESSAGES/sysstat.mo
/usr/share/locale/pt/LC_MESSAGES/sysstat.mo
/usr/share/locale/pt_BR/LC_MESSAGES/sysstat.mo
/usr/share/locale/ro/LC_MESSAGES/sysstat.mo
/usr/share/locale/ru/LC_MESSAGES/sysstat.mo
/usr/share/locale/sk/LC_MESSAGES/sysstat.mo
/usr/share/locale/sv/LC_MESSAGES/sysstat.mo
/usr/share/locale/vi/LC_MESSAGES/sysstat.mo
/usr/share/locale/zh_CN/LC_MESSAGES/sysstat.mo
/usr/share/locale/zh_TW/LC_MESSAGES/sysstat.mo
/usr/share/man/man1/cifsiostat.1.gz
/usr/share/man/man1/iostat.1.gz
/usr/share/man/man1/mpstat.1.gz
/usr/share/man/man1/pidstat.1.gz
/usr/share/man/man1/sadf.1.gz
/usr/share/man/man1/sar.1.gz
/usr/share/man/man5/sysstat.5.gz
/usr/share/man/man8/sa1.8.gz
/usr/share/man/man8/sa2.8.gz
/usr/share/man/man8/sadc.8.gz
/var/log/sa
[root@localhost ~]#
[root@localhost ~]# vmstat 1 7 #对当下的cpu采样的, 每隔一秒显示一次,共显示七次
procs -----------memory---------- ---swap-- -----io---- --system-- -----cpu-----
r b swpd free buff cache si so bi bo in cs us sy id wa st
2 0 0 1656780 31224 75212 0 0 2 0 4 3 0 0 100 0 0
0 0 0 1656772 31224 75212 0 0 0 0 44 29 0 0 100 0 0
0 0 0 1656772 31224 75212 0 0 0 0 14 16 0 0 100 0 0
0 0 0 1656748 31224 75212 0 0 0 0 21 27 0 0 100 0 0
0 0 0 1656748 31224 75212 0 0 0 0 21 33 0 0 100 0 0
0 0 0 1656756 31224 75212 0 0 0 0 27 27 0 0 100 0 0
0 0 0 1656756 31224 75212 0 0 0 0 13 16 0 0 100 0 0
[root@localhost ~]#
过去一天的cpu使用率如何,怎么分析?
sar能够将过去一天的cpu,或者各种资源使用率的情况定时采样(按照某种频率采样),采样的结果还保存在某个文件里面????,,,可以用sar命令去分析这个文件的,,,,,,,sar本身也支持直接去实现采样的分析
[root@localhost ~]# sar -q #也能显示当前系统的负载情况的
#也有过去的情况,每10分钟一次
Linux 2.6.32-754.el6.x86_64 (localhost.localdomain) 2021年07月15日 _x86_64_ (8 CPU)
00时00分01秒 runq-sz plist-sz ldavg-1 ldavg-5 ldavg-15
00时10分01秒 0 316 0.00 0.00 0.00
00时20分01秒 0 316 0.00 0.00 0.00
00时30分01秒 0 316 0.00 0.00 0.00
00时40分01秒 0 316 0.00 0.00 0.00
00时50分01秒 0 316 0.00 0.00 0.00
01时00分01秒 0 316 0.00 0.00 0.00
01时10分01秒 0 316 0.00 0.00 0.00
01时20分01秒 0 316 0.00 0.00 0.00
01时30分01秒 0 316 0.00 0.00 0.00
01时40分01秒 0 316 0.00 0.00 0.00
01时50分01秒 0 316 0.00 0.00 0.00
02时00分01秒 0 316 0.00 0.00 0.00
02时10分01秒 0 317 0.00 0.00 0.00
02时20分01秒 0 317 0.00 0.00 0.00
02时30分01秒 0 317 0.08 0.02 0.01
02时40分01秒 0 317 0.00 0.00 0.00
02时50分01秒 0 317 0.00 0.00 0.00
03时00分01秒 0 317 0.00 0.00 0.00
03时10分01秒 0 317 0.00 0.00 0.00
03时20分01秒 0 316 0.00 0.00 0.00
平均时间: 0 316 0.00 0.00 0.00
16时16分02秒 LINUX RESTART
16时20分01秒 runq-sz plist-sz ldavg-1 ldavg-5 ldavg-15
16时30分01秒 0 248 0.00 0.00 0.00
16时40分01秒 0 248 0.00 0.00 0.00
16时50分01秒 0 248 0.00 0.00 0.00
17时00分01秒 0 248 0.00 0.00 0.00
17时10分01秒 0 249 0.00 0.00 0.00
17时20分01秒 0 249 0.00 0.00 0.00
17时30分01秒 0 249 0.00 0.00 0.00
17时40分01秒 0 252 0.00 0.00 0.00
17时50分01秒 0 249 0.00 0.02 0.01
18时00分01秒 0 248 0.00 0.00 0.00
18时10分01秒 0 248 0.00 0.00 0.00
18时20分01秒 0 248 0.00 0.00 0.00
18时30分02秒 0 248 0.00 0.00 0.00
平均时间: 0 249 0.00 0.00 0.00
20时45分48秒 LINUX RESTART
20时50分01秒 runq-sz plist-sz ldavg-1 ldavg-5 ldavg-15
21时00分01秒 0 246 0.00 0.02 0.04
21时10分01秒 0 248 0.00 0.00 0.00
21时20分01秒 0 248 0.00 0.00 0.00
21时30分01秒 0 248 0.00 0.00 0.00
21时40分01秒 0 248 0.00 0.00 0.00
21时50分01秒 0 248 0.00 0.00 0.00
22时00分01秒 0 248 0.00 0.00 0.00
22时10分01秒 0 248 0.00 0.00 0.00
22时20分01秒 0 248 0.00 0.00 0.00
22时30分01秒 0 248 0.00 0.00 0.00
22时40分01秒 0 252 0.00 0.00 0.00
平均时间: 0 248 0.00 0.00 0.00
[root@localhost ~]#
[root@localhost ~]# sar -q 1 #查看当前,实时采样 ,每隔一秒钟,,,,,这个命令在红帽5上也有

[root@localhost ~]# man sar
Cannot open the message catalog "man" for locale "zh_CN.UTF-8"
(NLSPATH="/usr/share/locale/%l/LC_MESSAGES/%N")
Formatting page, please wait...
SAR(1) Linux User’s Manual SAR(1)
NAME
sar - Collect, report, or save system activity information.
SYNOPSIS
sar [ -A ] [ -b ] [ -B ] [ -C ] [ -d ] [ -h ] [ -i interval ] [ -m ] [
-p ] [ -q ] [ -r ] [ -R ] [ -S ] [ -t ] [ -u [ ALL ] ] [ -v ] [ -V ] [
-w ] [ -W ] [ -y ] [ -j { ID | LABEL | PATH | UUID | ... } ] [ -n {
keyword [,...] | ALL } ] [ -I { int [,...] | SUM | ALL | XALL } ] [ -P
{ cpu [,...] | ALL } ] [ -o [ filename ] | -f [ filename ] ] [ --legacy
] [ -s [ hh:mm:ss ] ] [ -e [ hh:mm:ss ] ] [ interval [ count ] ]
DESCRIPTION
The sar command writes to standard output the contents of selected
cumulative activity counters in the operating system. The accounting
system, based on the values in the count and interval parameters,
writes information the specified number of times spaced at the speci-
fied intervals in seconds. If the interval parameter is set to zero,
the sar command displays the average statistics for the time since the
system was started. If the interval parameter is specified without the
count parameter, then reports are generated continuously. The col-
lected data can also be saved in the file specified by the -o filename
flag, in addition to being displayed onto the screen. If filename is
omitted, sar uses the standard system activity daily data file, the
/var/log/sa/sadd file, where the dd parameter indicates the current
day. By default all the data available from the kernel are saved in
the data file.
The sar command extracts and writes to standard output records previ-
ously saved in a file. This file can be either the one specified by the
-f flag or, by default, the standard system activity daily data file.
Without the -P flag, the sar command reports system-wide (global among
all processors) statistics, which are calculated as averages for values
expressed as percentages, and as sums otherwise. If the -P flag is
given, the sar command reports activity which relates to the specified
processor or processors. If -P ALL is given, the sar command reports
statistics for each individual processor and global statistics among
all processors.
You can select information about specific system activities using
flags. Not specifying any flags selects only CPU activity. Specifying
the -A flag is equivalent to specifying -bBdqrRSvwWy -I SUM -I XALL -n
ALL -u ALL -P ALL.
The default version of the sar command (CPU utilization report) might
be one of the first facilities the user runs to begin system activity
investigation, because it monitors major system resources. If CPU uti-
lization is near 100 percent (user + nice + system), the workload sam-
pled is CPU-bound.
If multiple samples and multiple reports are desired, it is convenient
to specify an output file for the sar command. Run the sar command as
a background process. The syntax for this is:
sar -o datafile interval count >/dev/null 2>&1 &
All data is captured in binary form and saved to a file (datafile).
The data can then be selectively displayed with the sar command using
the -f option. Set the interval and count parameters to select count
records at interval second intervals. If the count parameter is not
set, all the records saved in the file will be selected. Collection of
data in this manner is useful to characterize system usage over a
period of time and determine peak usage hours.
Note: The sar command only reports on local activities.
OPTIONS
-A This is equivalent to specifying -bBdqrRSuvwWy -I SUM -I XALL -n
ALL -u ALL -P ALL.
-b Report I/O and transfer rate statistics. The following values
are displayed: #与I/O有关的
tps
Total number of transfers per second that were issued to
physical devices. A transfer is an I/O request to a
physical device. Multiple logical requests can be com-
bined into a single I/O request to the device. A trans-
fer is of indeterminate size.
rtps
Total number of read requests per second issued to physi-
cal devices.
wtps
Total number of write requests per second issued to phys-
ical devices.
bread/s
Total amount of data read from the devices in blocks per
second. Blocks are equivalent to sectors with 2.4 ker-
nels and newer and therefore have a size of 512 bytes.
With older kernels, a block is of indeterminate size.
bwrtn/s
Total amount of data written to devices in blocks per
second.
-B Report paging statistics. Some of the metrics below are avail-
able only with post 2.5 kernels. The following values are dis-
played: #查看内存页面置换情况的
pgpgin/s
Total number of kilobytes the system paged in from disk
per second. Note: With old kernels (2.2.x) this value is
a number of blocks per second (and not kilobytes).
pgpgout/s
Total number of kilobytes the system paged out to disk
per second. Note: With old kernels (2.2.x) this value is
a number of blocks per second (and not kilobytes).
fault/s
Number of page faults (major + minor) made by the system
per second. This is not a count of page faults that gen-
erate I/O, because some page faults can be resolved with-
out I/O.
majflt/s
Number of major faults the system has made per second,
those which have required loading a memory page from
disk.
pgfree/s
Number of pages placed on the free list by the system per
second.
pgscank/s
Number of pages scanned by the kswapd daemon per second.
pgscand/s
pgsteal/s
Number of pages the system has reclaimed from cache
(pagecache and swapcache) per second to satisfy its mem-
ory demands.
%vmeff
Calculated as pgsteal / pgscan, this is a metric of the
efficiency of page reclaim. If it is near 100% then
almost every page coming off the tail of the inactive
list is being reaped. If it gets too low (e.g. less than
30%) then the virtual memory is having some difficulty.
This field is displayed as zero if no pages have been
scanned during the interval of time.
-C When reading data from a file, tell sar to display comments that
have been inserted by sadc.
-d Report activity for each block device (kernels 2.4 and newer
only). When data is displayed, the device specification dev m-n
is generally used ( DEV column). m is the major number of the
device. With recent kernels (post 2.5), n is the minor number
of the device, but is only a sequence number with pre 2.5 ker-
nels. Device names may also be pretty-printed if option -p is
used or persistent device names can be printed if option -j is
used (see below). Values for fields avgqu-sz, await, svctm and
%util may be unavailable and displayed as 0.00 with some 2.4
kernels. Note that disk activity depends on sadc options "-S
DISK" and "-S XDISK" to be collected. The following values are
displayed:
tps # -d tps 每秒钟的事务数
Indicate the number of transfers per second that were
issued to the device. Multiple logical requests can be
combined into a single I/O request to the device. A
transfer is of indeterminate size.
rd_sec/s
Number of sectors read from the device. The size of a
sector is 512 bytes.
wr_sec/s
Number of sectors written to the device. The size of a
sector is 512 bytes.
avgrq-sz
The average size (in sectors) of the requests that were
issued to the device.
avgqu-sz
The average queue length of the requests that were issued
to the device.
await
The average time (in milliseconds) for I/O requests
issued to the device to be served. This includes the time
spent by the requests in queue and the time spent servic-
ing them.
svctm
The average service time (in milliseconds) for I/O
requests that were issued to the device.
%util
Percentage of elapsed time during which I/O requests were
issued to the device (bandwidth utilization for the
device). Device saturation occurs when this value is
close to 100%.
-e [ hh:mm:ss ]
Set the ending time of the report. The default ending time is
18:00:00. Hours must be given in 24-hour format. This option
can be used when data are read from or written to a file
(options -f or -o ).
-f [ filename ]
Extract records from filename (created by the -o filename flag).
The default value of the filename parameter is the current daily
data file, the /var/log/sa/sadd file. The -f option is exclusive
of the -o option.
-h Display a short help message then exit.
-i interval
Select data records at seconds as close as possible to the num-
ber specified by the interval parameter.
-I { int [,...] | SUM | ALL | XALL }
Report statistics for a given interrupt. int is the interrupt
number. Specifying multiple -I int parameters on the command
line will look at multiple independent interrupts. The SUM key-
word indicates that the total number of interrupts received per
second is to be displayed. The ALL keyword indicates that
statistics from the first 16 interrupts are to be reported,
whereas the XALL keyword indicates that statistics from all
interrupts, including potential APIC interrupt sources, are to
be reported. Note that interrupt statistics depend on sadc
option "-S INT" to be collected.
-j { ID | LABEL | PATH | UUID | ... }
Display persistent device names. Use this option in conjunction
with option -d. Options ID, LABEL, etc. specify the type of the
persistent name. These options are not limited, only prerequi-
site is that directory with required persistent names is present
in /dev/disk. If persistent name is not found for the device,
the device name is pretty-printed (see option -p below).
--legacy
Enable reading older /var/log/sa/sadd data files. In Red Hat
Enterprise Linux 6.3, the sysstat package was updated to version
9.0.4-20. This update changed the format of /var/log/sa/sadd
data files, but unfortunately, the format version was not
updated. Because of this, sysstat did not restrict reading of
data files in old format and while interpreting them, some dis-
played values could have been incorrect. The updated sysstat
package in Red Hat Enterprise Linux 6.5 contains fixed format
version of data files and prevents reading data files created by
older sysstat packages. However, data files created by the sys-
stat packages from Red Hat Enterprise Linux 6.3 and 6.4 are
fully compatible with the sysstat package from Red Hat Enter-
prise Linux 6.5. To enable latest sysstat to read older data
files, use this option. Note that this option allows you to read
also data files created on Red Hat Enterprise Linux 6.2 and ear-
lier, however, these files are not compatible with the latest
sysstat package.
-m Report power management statistics. Note that these statistics
depend on sadc option "-S POWER" to be collected. The following
value is displayed:
MHz
CPU clock frequency in MHz.
-n { keyword [,...] | ALL }
Report network statistics.
Possible keywords are DEV, EDEV, NFS, NFSD, SOCK, IP, EIP, ICMP,
EICMP, TCP, ETCP, UDP, SOCK6, IP6, EIP6, ICMP6, EICMP6 and UDP6.
With the DEV keyword, statistics from the network devices are
reported. The following values are displayed:
IFACE
Name of the network interface for which statistics are
reported.
rxpck/s
Total number of packets received per second.
txpck/s
Total number of packets transmitted per second.
rxkB/s
Total number of kilobytes received per second.
txkB/s
Total number of kilobytes transmitted per second.
rxcmp/s
Number of compressed packets received per second (for
cslip etc.).
txcmp/s
Number of compressed packets transmitted per second.
rxmcst/s
Number of multicast packets received per second.
With the EDEV keyword, statistics on failures (errors) from the
network devices are reported. The following values are dis-
played:
IFACE
Name of the network interface for which statistics are
reported.
rxerr/s
Total number of bad packets received per second.
txerr/s
Total number of errors that happened per second while
transmitting packets.
coll/s
Number of collisions that happened per second while
transmitting packets.
rxdrop/s
Number of received packets dropped per second because of
a lack of space in linux buffers.
txdrop/s
Number of transmitted packets dropped per second because
of a lack of space in linux buffers.
txcarr/s
Number of carrier-errors that happened per second while
transmitting packets.
rxfram/s
Number of frame alignment errors that happened per second
on received packets.
rxfifo/s
Number of FIFO overrun errors that happened per second on
received packets.
txfifo/s
Number of FIFO overrun errors that happened per second on
transmitted packets.
With the NFS keyword, statistics about NFS client activity are
reported. The following values are displayed:
....................................................................................................
-o [ filename ]
Save the readings in the file in binary form. Each reading is in
a separate record. The default value of the filename parameter
is the current daily data file, the /var/log/sa/sadd file. The
-o option is exclusive of the -f option. All the data available
from the kernel are saved in the file (in fact, sar calls its
data collector sadc with the option "-S ALL". See sadc(8) manual
page).
-P { cpu [,...] | ALL }
Report per-processor statistics for the specified processor or
processors. Specifying the ALL keyword reports statistics for
each individual processor, and globally for all processors.
Note that processor 0 is the first processor.
-p Pretty-print device names. Use this option in conjunction with
option -d. By default names are printed as dev m-n where m and
n are the major and minor numbers for the device. Use of this
option displays the names of the devices as they (should) appear
in /dev. Name mappings are controlled by /etc/sysconfig/sys-
stat.ioconf.
-q Report queue length and load averages. The following values are
displayed: #报告队列长度和负载平均值
runq-sz #运行队列的长度 run queue size
Run queue length (number of tasks waiting for run time).
plist-sz # process list size 进程列表中的个数,当前系统中的进程的个数
Number of tasks in the task list.
ldavg-1
System load average for the last minute. The load aver-
age is calculated as the average number of runnable or
running tasks (R state), and the number of tasks in unin-
terruptible sleep (D state) over the specified interval.
ldavg-5
System load average for the past 5 minutes.
ldavg-15
System load average for the past 15 minutes.
-r Report memory utilization statistics. The following values are
displayed:
kbmemfree
Amount of free memory available in kilobytes.
kbmemused
Amount of used memory in kilobytes. This does not take
into account memory used by the kernel itself.
%memused
Percentage of used memory.
kbbuffers
Amount of memory used as buffers by the kernel in kilo-
bytes.
kbcached
Amount of memory used to cache data by the kernel in
kilobytes.
kbcommit
Amount of memory in kilobytes needed for current work-
load. This is an estimate of how much RAM/swap is needed
to guarantee that there never is out of memory.
%commit
Percentage of memory needed for current workload in rela-
tion to the total amount of memory (RAM+swap). This num-
ber may be greater than 100% because the kernel usually
overcommits memory.
-R Report memory statistics. The following values are displayed:
frmpg/s
Number of memory pages freed by the system per second. A
negative value represents a number of pages allocated by
the system. Note that a page has a size of 4 kB or 8 kB
according to the machine architecture.
bufpg/s
Number of additional memory pages used as buffers by the
system per second. A negative value means fewer pages
used as buffers by the system.
campg/s
Number of additional memory pages cached by the system
per second. A negative value means fewer pages in the
cache.
-s [ hh:mm:ss ]
Set the starting time of the data, causing the sar command to
extract records time-tagged at, or following, the time speci-
fied. The default starting time is 08:00:00. Hours must be
given in 24-hour format. This option can be used only when data
are read from a file (option -f ).
-S Report swap space utilization statistics. The following values
are displayed:
kbswpfree
Amount of free swap space in kilobytes.
kbswpused
Amount of used swap space in kilobytes.
%swpused
Percentage of used swap space.
kbswpcad
Amount of cached swap memory in kilobytes. This is mem-
ory that once was swapped out, is swapped back in but
still also is in the swap area (if memory is needed it
doesn’t need to be swapped out again because it is
already in the swap area. This saves I/O).
%swpcad
Percentage of cached swap memory in relation to the
amount of used swap space.
.........................................................................................
runq-sz: run queue size 运行队列的长度,,,表示运行队列中的任务数,状态为TASK_RUNNING,对应于ps中的R sate.运行队列的长度(等待运行的进程数),,, 等待运行队列的长度, 值为29就表示 有20个进程在那边排着队,等着要运行,等着要调度,,,,如果单个cpu长期超出3的话,cpu该升级了,,,如果多cpu(或多核),需要平均一下进行计算,,,假如有3个进程一直在那时等待,换句话说这三个进程一直不会得到cpu,所以cpu性能就比较差了,观察一下cpu的使用率,可能就非常高了
plist-sz: process list size 进程列表中的个数,当前系统中的进程的个数,,,进程列表中进程(processes)和线程(threads)的数量
ldavg-1: load average last(past) 1 minute 最后一分钟的负载平均值 最后1分钟的系统平均负载(System load average)
ldavg-5: load average last(past) 5 minute 最后五分钟的负载平均值 过去5分钟的系统平均负载
ldavg-15: load average last(past) 15 minute 最后五分钟的负载平均值 过去15分钟的系统平均负载
[root@localhost ~]# sar -q 1
Linux 2.6.32-754.el6.x86_64 (localhost.localdomain) 2021年07月15日 _x86_64_ (8 CPU)
15时22分51秒 runq-sz plist-sz ldavg-1 ldavg-5 ldavg-15
15时22分52秒 0 248 0.00 0.00 0.00
15时22分53秒 0 248 0.00 0.00 0.00
15时22分54秒 0 248 0.00 0.00 0.00
15时22分55秒 0 248 0.00 0.00 0.00
15时22分56秒 0 248 0.00 0.00 0.00
15时22分57秒 0 248 0.00 0.00 0.00
15时22分58秒 0 248 0.00 0.00 0.00
15时22分59秒 0 248 0.00 0.00 0.00
15时23分00秒 0 248 0.00 0.00 0.00
15时23分01秒 0 248 0.00 0.00 0.00
15时23分02秒 0 248 0.00 0.00 0.00
15时23分03秒 0 248 0.00 0.00 0.00
15时23分04秒 0 248 0.00 0.00 0.00
15时23分05秒 0 248 0.00 0.00 0.00
15时23分06秒 0 248 0.00 0.00 0.00
15时23分07秒 0 248 0.00 0.00 0.00
15时23分08秒 0 248 0.00 0.00 0.00
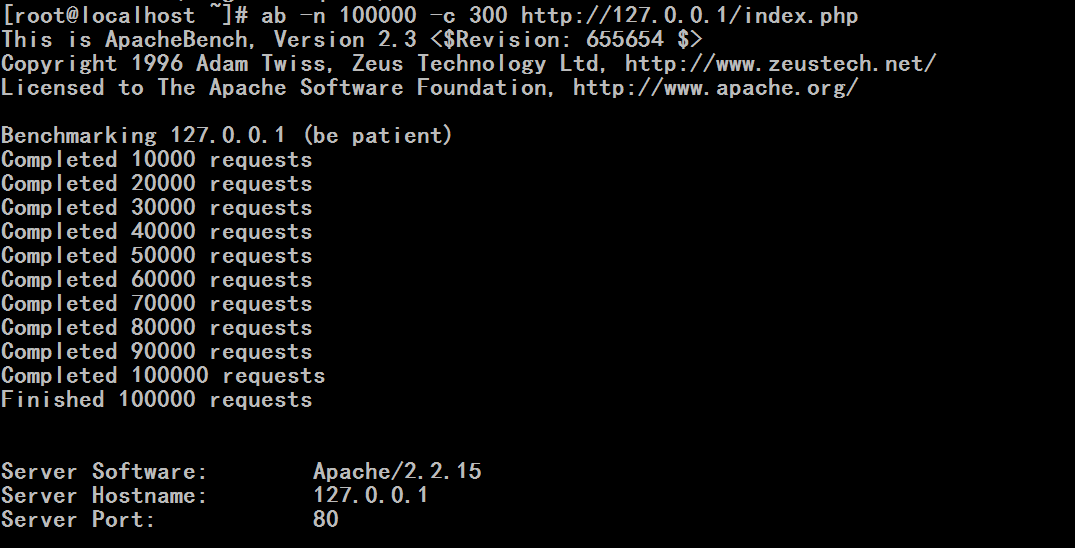
再开一个putty窗口
[root@localhost ~]# ab -n 100000 -c 300 http://127.0.0.1/index.php #进行压力测试
原来的putty窗口
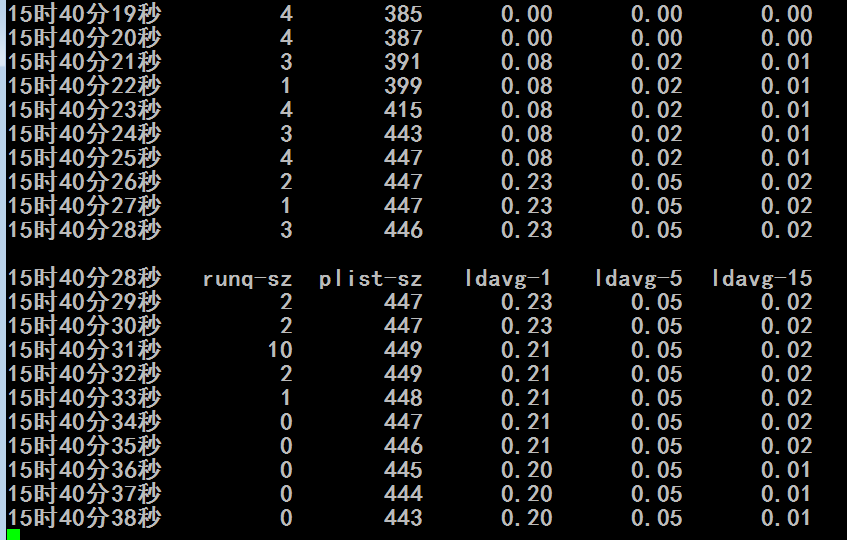
[root@localhost yum.repos.d]# sar -q 1
看到了 runq-sz,ldave-1,ldave-5,ldave-15 都有了增长
mpstat 1 2 # 能够显示对称多处理器的每一颗cpu的平均使用率,也是由软件sysstat提供的
sar -P ALL 1 2 # -P (processor)查看cpu的
iostat -c 1 2
/proc/stat
[root@localhost yum.repos.d]# man mpstat
Cannot open the message catalog "man" for locale "zh_CN.UTF-8"
(NLSPATH="/usr/share/locale/%l/LC_MESSAGES/%N")
Formatting page, please wait...
MPSTAT(1) Linux User’s Manual MPSTAT(1)
NAME
mpstat - Report processors related statistics.
SYNOPSIS
mpstat [ -A ] [ -I { SUM | CPU | ALL } ] [ -u ] [ -P { cpu [,...] | ON
| ALL } ] [ -V ] [ interval [ count ] ]
DESCRIPTION
The mpstat command writes to standard output activities for each avail-
able processor, processor 0 being the first one. Global average activ-
ities among all processors are also reported. The mpstat command can
be used both on SMP and UP machines, but in the latter, only global
average activities will be printed. If no activity has been selected,
then the default report is the CPU utilization report.
The interval parameter specifies the amount of time in seconds between
each report. A value of 0 (or no parameters at all) indicates that
processors statistics are to be reported for the time since system
startup (boot). The count parameter can be specified in conjunction
with the interval parameter if this one is not set to zero. The value
of count determines the number of reports generated at interval seconds
apart. If the interval parameter is specified without the count parame-
ter, the mpstat command generates reports continuously.
OPTIONS
-A This option is equivalent to specifying -I ALL -u -P ALL
-I { SUM | CPU | ALL } #interrupts ,显示cpu上所处理的中断的次数
Report interrupts statistics.
With the SUM keyword, the mpstat command reports the total num-
ber of interrupts per processor. The following values are dis-
played:
CPU
Processor number. The keyword all indicates that statis-
tics are calculated as averages among all processors.
intr/s
Show the total number of interrupts received per second
by the CPU or CPUs.
With the CPU keyword, the number of each individual interrupt
received per second by the CPU or CPUs is displayed.
The ALL keyword is equivalent to specifying all the keywords
above and therefore all the interrupts statistics are displayed.
-P { cpu [,...] | ON | ALL } #可以指定查看哪一颗cpu,不使用-P就是查看所有cpu
Indicate the processor number for which statistics are to be
reported. cpu is the processor number. Note that processor 0 is
the first processor. The ON keyword indicates that statistics
are to be reported for every online processor, whereas the ALL
keyword indicates that statistics are to be reported for all
processors.
-u Report CPU utilization. The following values are displayed:
CPU
Processor number. The keyword all indicates that statis-
tics are calculated as averages among all processors.
%usr
Show the percentage of CPU utilization that occurred
while executing at the user level (application).
%nice
Show the percentage of CPU utilization that occurred
while executing at the user level with nice priority.
%sys
Show the percentage of CPU utilization that occurred
while executing at the system level (kernel). Note that
this does not include time spent servicing hardware and
software interrupts.
%iowait
Show the percentage of time that the CPU or CPUs were
idle during which the system had an outstanding disk I/O
request.
%irq #硬中断
Show the percentage of time spent by the CPU or CPUs to
service hardware interrupts.
%soft #软中断
Show the percentage of time spent by the CPU or CPUs to
service software interrupts.
%steal
Show the percentage of time spent in involuntary wait by
the virtual CPU or CPUs while the hypervisor was servic-
ing another virtual processor.
%guest #来宾,表示虚拟机???
Show the percentage of time spent by the CPU or CPUs to
run a virtual processor.
%idle
Show the percentage of time that the CPU or CPUs were
idle and the system did not have an outstanding disk I/O
request.
Note: On SMP machines a processor that does not have any activ-
ity at all is a disabled (offline) processor.
-V Print version number then exit.
ENVIRONMENT
The mpstat command takes into account the following environment vari-
able:
S_TIME_FORMAT
If this variable exists and its value is ISO then the current
locale will be ignored when printing the date in the report
header. The mpstat command will use the ISO 8601 format (YYYY-
MM-DD) instead.
EXAMPLES
mpstat 2 5
Display five reports of global statistics among all processors
at two second intervals.
mpstat -P ALL 2 5
Display five reports of statistics for all processors at two
second intervals.
BUGS
[root@localhost yum.repos.d]# mpstat #只显示一次
Linux 2.6.32-754.el6.x86_64 (localhost.localdomain) 2021年07月15日 _x86_64_ (8 CPU)
16时38分47秒 CPU %usr %nice %sys %iowait %irq %soft %steal %guest %idle
16时38分47秒 all 0.01 0.00 0.03 0.02 0.00 0.01 0.00 0.00 99.94
[root@localhost yum.repos.d]#
%usr 用户空间占用
%nice 不同用户级别nice值对应使用的
%sys 内核空间占用
%iowait IO等待的
%irq:处理硬中断的
%soft 处理软中断
%steal 被虚拟机偷走的
%guest 来宾,虚拟机使用的
%idle 空闲的
[root@localhost yum.repos.d]# mpstat -P 0 1 # -P 0 表示0号cpu,,1表示每秒钟显示一次
Linux 2.6.32-754.el6.x86_64 (localhost.localdomain) 2021年07月15日 _x86_64_ (8 CPU)
16时39分25秒 CPU %usr %nice %sys %iowait %irq %soft %steal %guest %idle
16时39分26秒 0 0.00 0.00 0.00 0.00 0.00 0.00 0.00 0.00 100.00
16时39分27秒 0 0.00 0.00 0.00 0.00 0.00 0.00 0.00 0.00 100.00
16时39分28秒 0 0.00 0.00 0.00 0.00 0.00 0.00 0.00 0.00 100.00
16时39分29秒 0 0.00 0.00 0.00 0.00 0.00 0.00 0.00 0.00 100.00
16时39分30秒 0 0.00 0.00 0.00 0.00 0.00 0.00 0.00 0.00 100.00
16时39分31秒 0 0.00 0.00 0.00 0.00 0.00 0.00 0.00 0.00 100.00
16时39分32秒 0 0.00 0.00 0.00 0.00 0.00 0.00 0.00 0.00 100.00
16时39分33秒 0 0.00 0.00 0.00 0.00 0.00 0.00 0.00 0.00 100.00
16时39分34秒 0 0.00 0.00 0.00 0.00 0.00 0.00 0.00 0.00 100.00
16时39分35秒 0 0.00 0.00 0.00 0.00 0.00 0.00 0.00 0.00 100.00
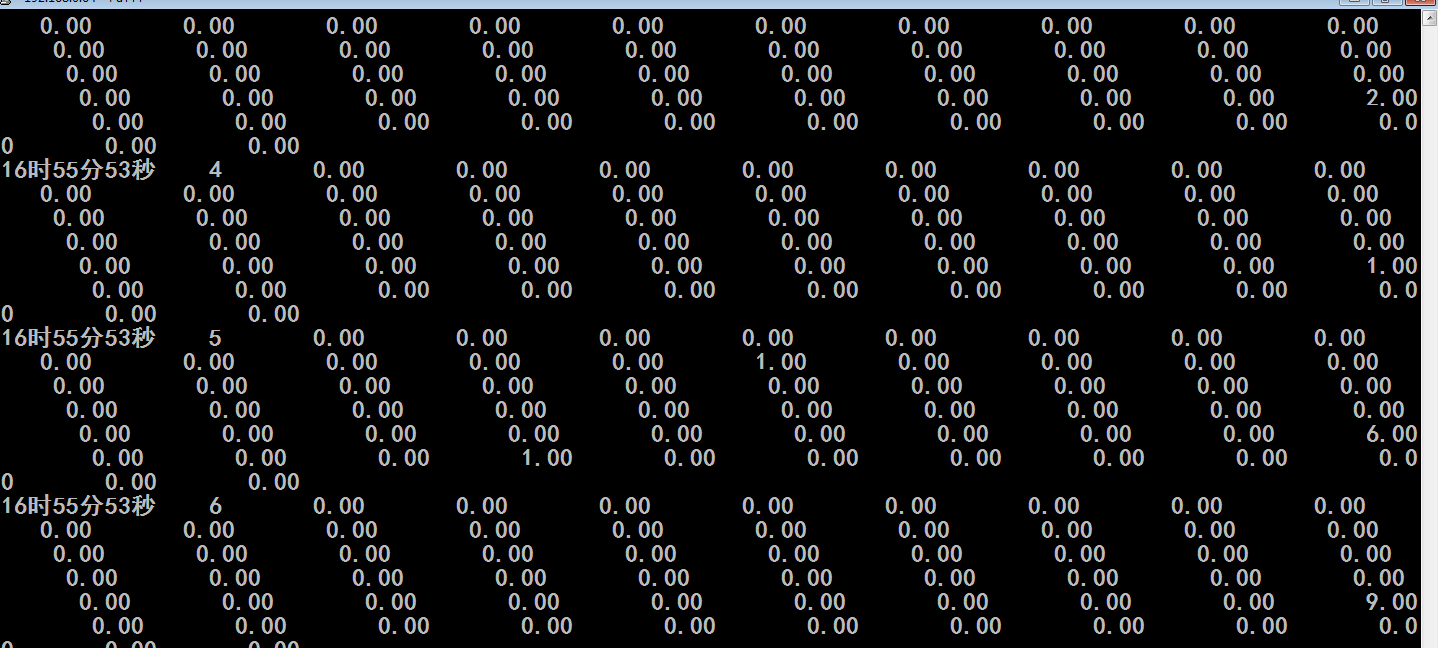
[root@localhost yum.repos.d]# mpstat -I CPU 1 #cpu上对每一个中断情况的处理 -I (interrupts )
[root@localhost yum.repos.d]# sar -P 0 1 #查看cpu的使用情况的 第0号cpu每秒钟显示一次
#跟mpstat显示的近似吧,没有mpstat显示的详细
Linux 2.6.32-754.el6.x86_64 (localhost.localdomain) 2021年07月15日 _x86_64_(8 CPU)
16时58分23秒 CPU %user %nice %system %iowait %steal %idle
16时58分24秒 0 0.00 0.00 0.00 0.00 0.00 100.00
16时58分25秒 0 0.00 0.00 0.00 0.00 0.00 100.00
16时58分26秒 0 0.00 0.00 0.00 0.00 0.00 100.00
16时58分27秒 0 0.00 0.00 0.00 0.00 0.00 100.00
16时58分28秒 0 0.00 0.00 0.00 0.00 0.00 100.00
[root@localhost yum.repos.d]# man iostat #io统计的命令,也能实现cpu使用率的统计
Cannot open the message catalog "man" for locale "zh_CN.UTF-8"
(NLSPATH="/usr/share/locale/%l/LC_MESSAGES/%N")
Formatting page, please wait...
IOSTAT(1) Linux User’s Manual IOSTAT(1)
NAME
iostat - Report Central Processing Unit (CPU) statistics and input/out-
put statistics for devices, partitions and network filesystems (NFS).
#报告中央处理器(CPU)的统计数据和输入输出统计数据,还能实现分区数据的查看和网络文件系统的数据的查看
SYNOPSIS
iostat [ -c ] [ -d ] [ -N ] [ -n ] [ -h ] [ -k | -m ] [ -t ] [ -V ] [
-x ] [ -y ] [ -z ] [ -j { ID | LABEL | PATH | UUID | ... } [ device
[...] | ALL ] ] [ device [...] | ALL ] [ -p [ device [,...] | ALL ] ] [
interval [ count ] ]
DESCRIPTION
The iostat command is used for monitoring system input/output device
loading by observing the time the devices are active in relation to
their average transfer rates. The iostat command generates reports that
can be used to change system configuration to better balance the
input/output load between physical disks.
The first report generated by the iostat command provides statistics
concerning the time since the system was booted, unless the -y option
is used, when this first report is omitted. Each subsequent report cov-
ers the time since the previous report. All statistics are reported
each time the iostat command is run. The report consists of a CPU
header row followed by a row of CPU statistics. On multiprocessor sys-
tems, CPU statistics are calculated system-wide as averages among all
processors. A device header row is displayed followed by a line of
statistics for each device that is configured. When option -n is used,
an NFS header row is displayed followed by a line of statistics for
each network filesystem that is mounted.
The interval parameter specifies the amount of time in seconds between
each report. The first report contains statistics for the time since
system startup (boot), unless the -y option is used, when this report
is omitted. Each subsequent report contains statistics collected dur-
ing the interval since the previous report. The count parameter can be
specified in conjunction with the interval parameter. If the count
parameter is specified, the value of count determines the number of
reports generated at interval seconds apart. If the interval parameter
is specified without the count parameter, the iostat command generates
reports continuously.
REPORTS
The iostat command generates three types of reports, the CPU Utiliza-
tion report, the Device Utilization report and the Network Filesystem
report.
CPU Utilization Report #报告cpu使用情况
The first report generated by the iostat command is the CPU Uti-
lization Report. For multiprocessor systems, the CPU values are
global averages among all processors. The report has the fol-
lowing format:
%user
Show the percentage of CPU utilization that occurred
while executing at the user level (application).
%nice
Show the percentage of CPU utilization that occurred
while executing at the user level with nice priority.
%system
Show the percentage of CPU utilization that occurred
while executing at the system level (kernel).
%iowait
Show the percentage of time that the CPU or CPUs were
idle during which the system had an outstanding disk I/O
request.
%steal
Show the percentage of time spent in involuntary wait by
the virtual CPU or CPUs while the hypervisor was servic-
ing another virtual processor.
%idle
Show the percentage of time that the CPU or CPUs were
idle and the system did not have an outstanding disk I/O
request.
Device Utilization Report #报告设备使用情况
The second report generated by the iostat command is the Device
Utilization Report. The device report provides statistics on a
per physical device or partition basis. Block devices for which
statistics are to be displayed may be entered on the command
line. Partitions may also be entered on the command line provid-
ing that option -x is not used. If no device nor partition is
entered, then statistics are displayed for every device used by
the system, and providing that the kernel maintains statistics
for it. If the ALL keyword is given on the command line, then
statistics are displayed for every device defined by the system,
including those that have never been used. The report may show
the following fields, depending on the flags used:
Device:
This column gives the device (or partition) name, which
is displayed as hdiskn with 2.2 kernels, for the nth
device. It is displayed as devm-n with 2.4 kernels, where
m is the major number of the device, and n a distinctive
number. With newer kernels, the device name as listed in
the /dev directory is displayed.
tps
Indicate the number of transfers per second that were
issued to the device. A transfer is an I/O request to the
device. Multiple logical requests can be combined into a
single I/O request to the device. A transfer is of inde-
terminate size.
Blk_read/s
Indicate the amount of data read from the device
expressed in a number of blocks per second. Blocks are
equivalent to sectors with kernels 2.4 and later and
therefore have a size of 512 bytes. With older kernels, a
block is of indeterminate size.
Blk_wrtn/s
Indicate the amount of data written to the device
expressed in a number of blocks per second.
Blk_read
The total number of blocks read.
Blk_wrtn
The total number of blocks written.
kB_read/s
Indicate the amount of data read from the device
expressed in kilobytes per second.
kB_wrtn/s
Indicate the amount of data written to the device
expressed in kilobytes per second.
kB_read
The total number of kilobytes read.
kB_wrtn
The total number of kilobytes written.
MB_read/s
Indicate the amount of data read from the device
expressed in megabytes per second.
MB_wrtn/s
Indicate the amount of data written to the device
expressed in megabytes per second.
MB_read
The total number of megabytes read.
MB_wrtn
The total number of megabytes written.
rrqm/s
The number of read requests merged per second that were
queued to the device.
wrqm/s
The number of write requests merged per second that were
queued to the device.
r/s
The number of read requests that were issued to the
device per second.
w/s
The number of write requests that were issued to the
device per second.
rsec/s
The number of sectors read from the device per second.
wsec/s
The number of sectors written to the device per second.
rkB/s
The number of kilobytes read from the device per second.
wkB/s
The number of kilobytes written to the device per second.
rMB/s
The number of megabytes read from the device per second.
wMB/s
The number of megabytes written to the device per second.
avgrq-sz
The average size (in sectors) of the requests that were
issued to the device.
avgqu-sz
The average queue length of the requests that were issued
to the device.
await
The average time (in milliseconds) for I/O requests
issued to the device to be served. This includes the time
spent by the requests in queue and the time spent servic-
ing them.
svctm
The average service time (in milliseconds) for I/O
requests that were issued to the device. Warning! Do not
trust this field any more. This field will be removed in
a future sysstat version.
%util
Percentage of elapsed time during which I/O requests were
issued to the device (bandwidth utilization for the
device). Device saturation occurs when this value is
close to 100%.
Network Filesystem report #报告网络文件系统使用情况
The Network Filesystem (NFS) report provides statistics for each
mounted network filesystem. The report shows the following
fields:
Filesystem:
This columns shows the hostname of the NFS server fol-
lowed by a colon and by the directory name where the net-
work filesystem is mounted.
rBlk_nor/s
Indicate the number of blocks read by applications via
the read(2) system call interface. A block has a size of
512 bytes.
wBlk_nor/s
Indicate the number of blocks written by applications via
the write(2) system call interface.
rBlk_dir/s
Indicate the number of blocks read from files opened with
the O_DIRECT flag.
wBlk_dir/s
Indicate the number of blocks written to files opened
with the O_DIRECT flag.
rBlk_svr/s
Indicate the number of blocks read from the server by the
NFS client via an NFS READ request.
wBlk_svr/s
Indicate the number of blocks written to the server by
the NFS client via an NFS WRITE request.
rkB_nor/s
Indicate the number of kilobytes read by applications via
the read(2) system call interface.
wkB_nor/s
Indicate the number of kilobytes written by applications
via the write(2) system call interface.
rkB_dir/s
Indicate the number of kilobytes read from files opened
with the O_DIRECT flag.
wkB_dir/s
Indicate the number of kilobytes written to files opened
with the O_DIRECT flag.
...................................................................
OPTIONS
-c Display the CPU utilization report. #显示cpu的
-d Display the device utilization report. #显示设备的
-h Make the NFS report displayed by option -n easier to read by a
human.
-j { ID | LABEL | PATH | UUID | ... } [ device [...] | ALL ]
Display persistent device names. Options ID, LABEL, etc. specify
the type of the persistent name. These options are not limited,
only prerequisite is that directory with required persistent
names is present in /dev/disk. Optionally, multiple devices can
be specified in the chosen persistent name type.
-k Display statistics in kilobytes per second instead of blocks per
second. Data displayed are valid only with kernels 2.4 and
later.
-m Display statistics in megabytes per second instead of blocks or
kilobytes per second. Data displayed are valid only with ker-
nels 2.4 and later.
-N Display the registered device mapper names for any device mapper
devices. Useful for viewing LVM2 statistics.
-n Display the network filesystem (NFS) report. This option works
only with kernel 2.6.17 and later. #显示网络文件系统的
-p [ { device [,...] | ALL } ]
The -p option displays statistics for block devices and all
their partitions that are used by the system. If a device name
is entered on the command line, then statistics for it and all
its partitions are displayed. Last, the ALL keyword indicates
that statistics have to be displayed for all the block devices
and partitions defined by the system, including those that have
never been used. If option -j is defined before this option,
devices entered on the command line can be specified with the
chosen persistent name type. Note that this option works only
with post 2.5 kernels.
-t Print the time for each report displayed. The timestamp format
may depend on the value of the S_TIME_FORMAT environment vari-
able (see below).
-V Print version number then exit.
-x Display extended statistics. This option works with post 2.5
kernels since it needs /proc/diskstats file or a mounted sysfs
to get the statistics. This option may also work with older ker-
nels (e.g. 2.4) only if extended statistics are available in
/proc/partitions (the kernel needs to be patched for that).
-y Omit first report with statistics since the system boot, if dis-
playing multiple records in given interval.
-z Tell iostat to omit output for any devices for which there was
no activity during the sample period.
ENVIRONMENT
[root@localhost yum.repos.d]# iostat -c #cpu的使用状况
Linux 2.6.32-754.el6.x86_64 (localhost.localdomain) 2021年07月15日 _x86_64_ (8 CPU)
avg-cpu: %user %nice %system %iowait %steal %idle
0.01 0.00 0.03 0.01 0.00 99.95
[root@localhost yum.repos.d]#
[root@localhost yum.repos.d]# iostat -c 1 #cpu的使用状况每秒显示一次
Linux 2.6.32-754.el6.x86_64 (localhost.localdomain) 2021年07月15日 _x86_64_ (8 CPU)
avg-cpu: %user %nice %system %iowait %steal %idle
0.01 0.00 0.03 0.01 0.00 99.95
avg-cpu: %user %nice %system %iowait %steal %idle
0.00 0.00 0.12 0.00 0.00 99.88
avg-cpu: %user %nice %system %iowait %steal %idle
0.00 0.00 0.00 0.00 0.00 100.00
avg-cpu: %user %nice %system %iowait %steal %idle
0.00 0.00 0.00 0.00 0.00 100.00
avg-cpu: %user %nice %system %iowait %steal %idle
0.00 0.00 0.12 0.00 0.00 99.88
iostat的这些用法与vmstat一样
[root@localhost yum.repos.d]# iostat -c 1 6 #cpu的使用状况每秒显示一次,共采样6次,
#%iowait过长的话,意味着要检查io输入输出状况了,有可能磁盘是性能瓶颈
#%system占用的比例过高,意味着内核空间消耗的时间太长,真正提供服务的时间太短了,这时要观察一下哪个进程,需要执行的什么操作,到底为什么内核占据那么长的时间,,,,
#%steal在支持硬件虚拟化的cpu上,而且使用了虚拟机的cpu上,%steal的量可能也不小
Linux 2.6.32-754.el6.x86_64 (localhost.localdomain) 2021年07月15日 _x86_64_(8 CPU)
avg-cpu: %user %nice %system %iowait %steal %idle
0.01 0.00 0.03 0.01 0.00 99.95
avg-cpu: %user %nice %system %iowait %steal %idle
0.00 0.00 0.00 0.00 0.00 100.00
avg-cpu: %user %nice %system %iowait %steal %idle
0.00 0.00 0.00 0.00 0.00 100.00
avg-cpu: %user %nice %system %iowait %steal %idle
0.00 0.00 0.00 0.00 0.00 100.00
avg-cpu: %user %nice %system %iowait %steal %idle
0.00 0.00 0.00 0.00 0.00 100.00
avg-cpu: %user %nice %system %iowait %steal %idle
0.00 0.00 0.00 0.00 0.00 100.00
[root@localhost yum.repos.d]#
[root@localhost yum.repos.d]# cat /proc/stat #cpu的数据统计,其实上面的几个命令基本上都是从这里面专门去获取信息并以用户非常直观的方式显示出来的
cpu 728 0 3062 14251890 1758 5 1251 0 0
cpu0 93 0 393 1781419 199 2 180 0 0
cpu1 72 0 331 1781152 150 0 414 0 0
cpu2 81 0 256 1781801 147 0 118 0 0
cpu3 138 0 770 1781034 367 0 86 0 0
cpu4 88 0 421 1781457 309 0 166 0 0
cpu5 82 0 356 1781459 180 2 139 0 0
cpu6 94 0 292 1781680 219 0 93 0 0
cpu7 75 0 240 1781884 182 0 52 0 0
intr 657463 205 8 0 1 1 0 0 0 60 0 0 0 110 0 0 245 0 8377 63 37271 0 0 0 0 0 0 0 0 0 0 0 0 0 0 0 0 0 0 0 0 0 0 0 0 0 0 0 0 0 0 0 0 0 0 0 0 0 0 0 0 0 0 0 0 0 0 0 0 0 0 0 0 0 0 0 0 0 0 0 0 0 0 0 0 0 0 0 0 0 0 0 0 0 0 0 0 0 0 0 0 0 0 0 0 0 0 0 0 0 0 0 0 0 0 0 0 0 0 0 0 0 0 0 0 0 0 0 0 0 0 0 0 0 0 0 0 0 0 0 0 0 0 0 0 0 0 0 0 0 0 0 0 0 0 0 0 0 0 0 0 0 0 0 0 0 0 0 0 0 0 0 0 0 0 0 0 0 0 0 0 0 0 0 0 0 0 0 0 0 0 0 0 0 0 0 0 0 0 0 0 0 0 0 0 0 0 0 0 0 0 0 0 0 0 0 0 0 0 0 0 0 0 0 0 0 0 0 0 0 0 0 0 0 0 0 0 0 0 0 0 0 0 0 0 0 0 0 0 0 0 0 0 0 0 0 0 0 0 0 0 0 0 0 0 0 0 0 0 0 0 0 0 0 0 0 0 0 0 0 0 0 0 0 0 0 0 0 0 0 0 0 0 0 0 0 0 0 0 0 0 0 0 0 0 0 0 0 0 0 0 0 0 0 0 0 0 0 0 0 0 0 0 0 0 0 0 0 0 0 0 0 0 0 0 0 0 0 0 0 0 0 0 0 0 0 0 0 0 0 0 0 0 0 0 0 0 0 0 0 0 0 0 0 0 0 0 0 0 0 0 0 0 0 0 0 0 0 0 0 0 0 0 0 0 0 0 0 0 0 0 0 0 0 0 0 0 0 0 0 0 0 0 0 0 0 0 0 0 0 0 0 0 0 0 0 0 0 0 0 0 0 0 0 0 0 0 0 0 0 0 0 0 0 0 0 0 0 0 0 0 0 0 0 0 0 0 0 0 0 0 0 0 0 0 0 0 0 0 0 0 0 0 0 0 0 0 0 0 0 0 0 0 0 0 0 0 0 0 0 0 0 0 0 0 0 0 0 0 0 0 0 0 0 0 0 0 0 0 0 0 0 0 0 0 0 0 0 0 0 0 0 0 0 0 0 0 0 0 0 0 0 0 0 0 0 0 0 0 0 0 0 0 0 0 0 0 0 0 0 0 0 0 0 0 0 0 0 0 0 0 0 0 0 0 0 0 0 0 0 0 0 0 0 0 0 0 0 0 0 0 0 0 0 0 0 0 0 0 0 0 0 0 0 0 0 0 0 0 0 0 0 0 0 0 0 0 0 0 0 0 0 0 0 0 0 0 0 0 0 0 0 0 0 0 0 0 0 0 0 0 0 0 0 0 0 0 0 0 0 0 0 0 0 0 0 0 0 0 0 0 0 0 0 0 0 0 0 0 0 0 0 0 0 0 0 0 0 0 0 0 0 0 0 0
ctxt 728376
btime 1626324304
processes 3485
procs_running 1
procs_blocked 0
softirq 1947767 0 441372 3562 751530 8542 0 2 240769 340 501650
[root@localhost yum.repos.d]#
dstat (data Statistics ?????)命令,如果没有这个命令,装下dstat包吧,红帽5上系统没有自带,红帽6上有,
[root@localhost yum.repos.d]# man dstat
Cannot open the message catalog "man" for locale "zh_CN.UTF-8"
(NLSPATH="/usr/share/locale/%l/LC_MESSAGES/%N")
Formatting page, please wait...
DSTAT(1) DSTAT(1)
NAME
dstat - versatile tool for generating system resource statistics #又是一个系统资源统计的命令
SYNOPSIS
dstat [-afv] [options..] [delay [count]]
DESCRIPTION
Dstat is a versatile replacement for vmstat, iostat and ifstat. Dstat
overcomes some of the limitations and adds some extra features.
Dstat allows you to view all of your system resources instantly, you
can eg. compare disk usage in combination with interrupts from your IDE
controller, or compare the network bandwidth numbers directly with the
disk throughput (in the same interval).
Dstat also cleverly gives you the most detailed information in columns
and clearly indicates in what magnitude and unit the output is
displayed. Less confusion, less mistakes, more efficient.
Dstat is unique in letting you aggregate block device throughput for a
certain diskset or network bandwidth for a group of interfaces, ie. you
can see the throughput for all the block devices that make up a single
filesystem or storage system.
Dstat allows its data to be directly written to a CSV file to be
imported and used by OpenOffice, Gnumeric or Excel to create graphs.
Note
Users of Sleuthkit might find Sleuthkit’s dstat being renamed to
datastat to avoid a name conflict. See Debian bug #283709 for more
information.
OPTIONS
-c, --cpu #这里-c cpu的
enable cpu stats (system, user, idle, wait, hardware interrupt,
software interrupt)
-C 0,3,total #这里-C
include cpu0, cpu3 and total
-d, --disk #这里-d
enable disk stats (read, write)
-D total,hda #这里-D
include hda and total
-g, --page
enable page stats (page in, page out)
-i, --int
enable interrupt stats
-I 5,10
include interrupt 5 and 10
-l, --load
enable load average stats (1 min, 5 mins, 15mins)
-m, --mem #这里是内存的
enable memory stats (used, buffers, cache, free)
-n, --net #这里是网络的
enable network stats (receive, send)
-N eth1,total #这里是网卡的
include eth1 and total
-p, --proc #这里是proc的
enable process stats (runnable, uninterruptible, new)
-r, --io #这里是io的
enable I/O request stats (read, write requests)
-s, --swap
enable swap stats (used, free)
-S swap1,total
include swap1 and total
-t, --time #这里是时间的
enable time/date output
-T, --epoch
enable time counter (seconds since epoch)
-y, --sys
enable system stats (interrupts, context switches)
--aio enable aio stats (asynchronous I/O) #这里是aio的
--fs enable filesystem stats (open files, inodes) #这里是文件系统的
--ipc enable ipc stats (message queue, semaphores, shared memory) #这里是ipc的
--lock enable file lock stats (posix, flock, read, write) #这里锁的
--raw enable raw stats (raw sockets)
--socket #这里套接字的
enable socket stats (total, tcp, udp, raw, ip-fragments)
--tcp enable tcp stats (listen, established, syn, time_wait, close) #这里tcp 的
--udp enable udp stats (listen, active) #这里udp 的
--unix enable unix stats (datagram, stream, listen, active) #这里unix 的
--vm enable vm stats (hard pagefaults, soft pagefaults, allocated,#这里vm 的
free)
--stat1 --stat2 #这里stat的
enable (external) plugins by plugin name, see PLUGINS for
options
Possible internal stats are
aio, cpu, cpu24, disk, disk24, disk24old, epoch, fs, int, int24,
io, ipc, load, lock, mem, net, page, page24, proc, raw, socket,
swap, swapold, sys, tcp, time, udp, unix, vm
--list list the internal and external plugin names
-a, --all #这里是all的
equals -cdngy (default)
-f, --full
expand -C, -D, -I, -N and -S discovery lists
-v, --vmstat
equals -pmgdsc -D total
--bw, --blackonwhite
change colors for white background terminal
--float
force float values on screen (mutual exclusive with --integer)
--integer
force integer values on screen (mutual exclusive with --float)
--nocolor
disable colors (implies --noupdate)
--noheaders
disable repetitive headers
--noupdate
disable intermediate updates when delay > 1
--output file
write CSV output to file
PLUGINS #利用某些插件功能更强大
While anyone can create their own dstat plugins (and contribute them)
dstat ships with a number of plugins already that extend its
capabilities greatly. Here is an overview of the plugins dstat ships
with:
--battery #电池
battery in percentage (needs ACPI)
--battery-remain #电池剩余
battery remaining in hours, minutes (needs ACPI)
--cpufreq #cpu频率
CPU frequency in percentage (needs ACPI)
--dbus number of dbus connections (needs python-dbus)
--disk-util #磁盘利用率
per disk utilization in percentage
--fan fan speed (needs ACPI)
--freespace
per filesystem disk usage
--gpfs GPFS read/write I/O (needs mmpmon) #gpfs 文件系统的读取
--gpfs-ops
GPFS filesystem operations (needs mmpmon)
--helloworld
Hello world example dstat plugin
--innodb-buffer #mysql的innodb存储引擎的相关情况
show innodb buffer stats
--innodb-io
show innodb I/O stats
--innodb-ops
show innodb operations counters
--lustre #一种分布式文件系统的存储情况
show lustre I/O throughput
--memcache-hits #memcache的命中率
show the number of hits and misses from memcache
--mysql5-cmds #mysql的各种命令
show the MySQL5 command stats
--mysql5-conn
show the MySQL5 connection stats
--mysql5-io
--mysql5-keys
show the MySQL5 keys stats
--mysql-io
show the MySQL I/O stats
--mysql-keys
show the MySQL keys stats
--net-packets
show the number of packets received and transmitted
--nfs3 show NFS v3 client operations
--nfs3-ops
show extended NFS v3 client operations
--nfsd3
show NFS v3 server operations
--nfsd3-ops
show extended NFS v3 server operations
--ntp show NTP time from an NTP server
--postfix
show postfix queue sizes (needs postfix)
--power
show power usage
--proc-count
show total number of processes
--rpc show RPC client calls stats
--rpcd show RPC server calls stats
--sendmail
show sendmail queue size (needs sendmail)
--snooze
show number of ticks per second
--test show test plugin output
--thermal
system temperature sensors
--top-bio
show most expensive block I/O process
--top-cpu #这个很有用 哪个进程最消耗cpu
show most expensive CPU process
--top-cputime #哪个进程最消耗cpu时间(毫秒为单位)
show process using the most CPU time (in ms)
--top-cputime-avg #哪个进程消耗了最多的cpu时间片
show process with the highest average timeslice (in ms)
--top-io #这个很有用 哪个进程最消耗I/O
show most expensive I/O process
--top-latency #哪个进程有着最大的延迟(可能因为i/o或其它情况)
show process with highest total latency (in ms)
--top-latency-avg
show process with the highest average latency (in ms)
--top-mem #哪个进程用了最多的内存
show process using the most memory
--top-oom
show process that will be killed by OOM the first
--utmp show number of utmp connections (needs python-utmp)
--vmk-hba
show VMware ESX kernel vmhba stats
--vmk-int
show VMware ESX kernel interrupt stats
--vmk-nic
show VMware ESX kernel port stats
--vm-memctl
show ballooning status inside VMware guests
--vz-io
show CPU usage per OpenVZ guest
--vz-ubc
show OpenVZ user beancounters
--wifi wireless link quality and signal to noise ratio
[root@localhost ~]# dstat --top-cpu #不停的显示哪个进程最占cpu
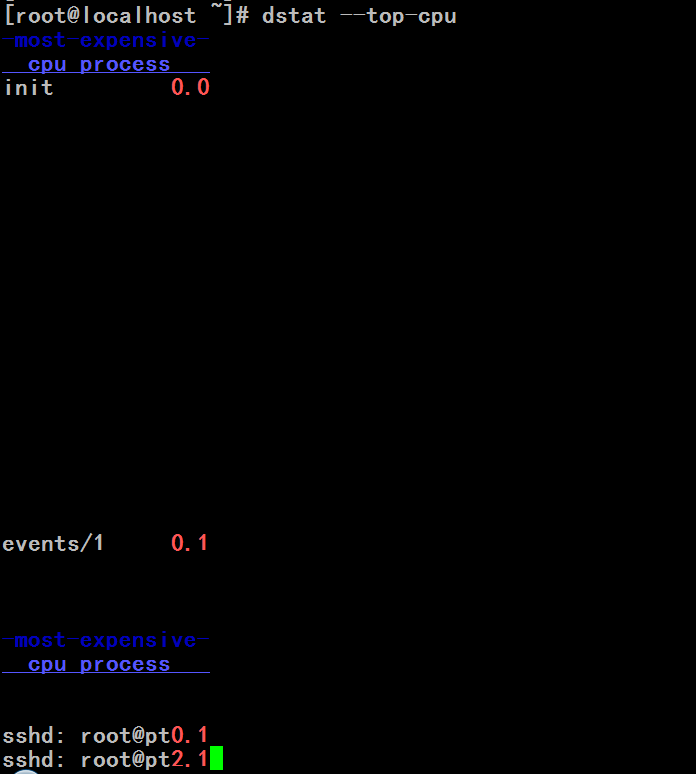
[root@localhost ~]# dstat --top-mem #不停的显示哪个进程最占内存

[root@localhost ~]# dstat --top-mem --top-cpu #两个mem 和 cpu同时使用
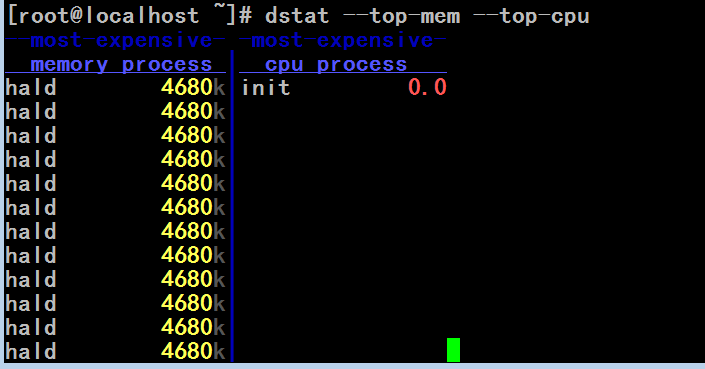
[root@localhost ~]# dstat --top-mem --top-cpu --top-io #三个同时使用
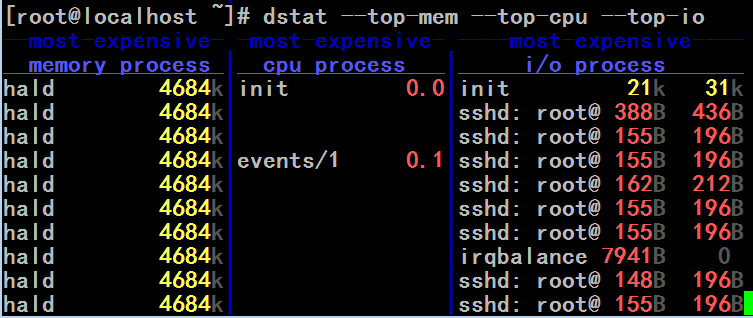
[root@localhost ~]# dstat -c #显示cpu的使用率
用户空间 系统空间 空闲的 等待io 硬件中断 软中断
usr sys idl wai hiq siq
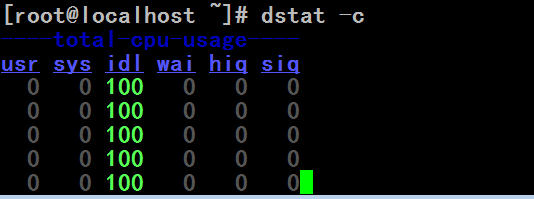
观察上下文切换的次数
[root@localhost ~]# vmstat 1 #cs就是上下文切换
procs -----------memory---------- ---swap-- -----io---- --system-- -----cpu-----
r b swpd free buff cache si so bi bo in cs us sy id wa st
0 0 0 1669168 18864 74352 0 0 4 0 8 5 0 0 100 0 0
0 0 0 1669012 18864 74352 0 0 0 0 45 30 0 0 100 0 0
0 0 0 1669012 18864 74352 0 0 0 0 19 15 0 0 100 0 0
0 0 0 1669012 18864 74352 0 0 0 0 28 28 0 0 100 0 0
0 0 0 1669012 18864 74352 0 0 0 0 18 15 0 0 100 0 0
0 0 0 1669012 18864 74352 0 0 0 0 32 26 0 0 100 0 0
0 0 0 1669012 18864 74352 0 0 0 0 18 15 0 0 100 0 0
[root@localhost ~]# man sar
...................................................................................................................................................
-w Report task creation and system switching activity. #-w上下文切换,
proc/s
Total number of tasks created per second. #它能够报告每秒钟我们系统创建的进程的个数
cswch/s
Total number of context switches per second. #它能够报告每秒钟我们上下文切换的次数
...................................................................................................................................................
[root@localhost ~]# sar -w 1 #查看上下文切换的平均次数以及进程创建的平均值,以秒为单位 这里-w 后面的1表示的是1秒显示一批,,,如果-w 后面的5表示的是5秒显示一批
Linux 2.6.32-754.el6.x86_64 (localhost.localdomain) 2021年07月16日 _x86_64_(8 CPU)
09时11分03秒 proc/s cswch/s
09时11分04秒 0.00 18.00
09时11分05秒 0.00 90.00
09时11分06秒 0.00 81.00
09时11分07秒 0.00 94.00
#上下文切换如果过多的话,意味着我们的进程有点多了,,,如果中断处理过多的话,可能意味着外围硬件很繁忙,,,通常情况下,作为网络服务器的话,中断次数多是很正常的
cpu上linux支持调度器域,可以事先将cpu划好组,而后使用类似于taskset所实现的功能,将某个进程绑定在某个组内的cpu上,而不是绑定在某个特定的cpu上
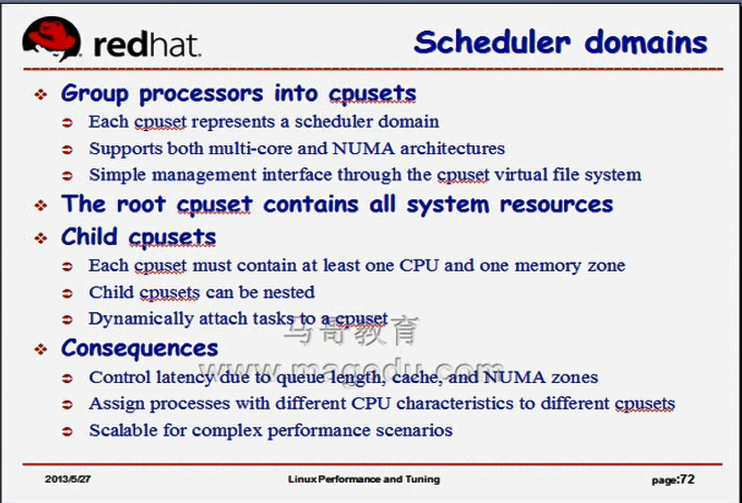
如下图,
cpu的调度域,根文件系统一样,把cpu组织成了倒置的树状结构,组成了一个文件系统,,,,所有的cpu都属于根域,里面划分两个左右子域,每个子域里面有两个cpu,,,我们可以把某进程绑定在左边的域上,,,每一个子域,还可以再划分子子域,比如把左边子域再划分一次子子域,把cpu0绑定到子子域上,,,,,再划分一个子子域,把cpu2绑定到另一个子子域上,,,,此时如果让某一个进程运行在根域上,意味着这个进程可以运行在所有的cpu上,,如果某一个进程运行在右边子域上,表示此进程可以运行在cpu1,cpu3,,,,,如果运行在..........
这种cpu的划分机制,除了cpu划分归类,还得内存划分归类,,,,如果是numa结构的话,容易理解,如果是非numa结构的话,内存段仅有一段,由此任何一个子域内得包括第0段内存???????,,,,,,,否则第0号cpu所在的位置可以带上第0段内存,否则第2号cpu所在的位置可以带上第2段内存,???????
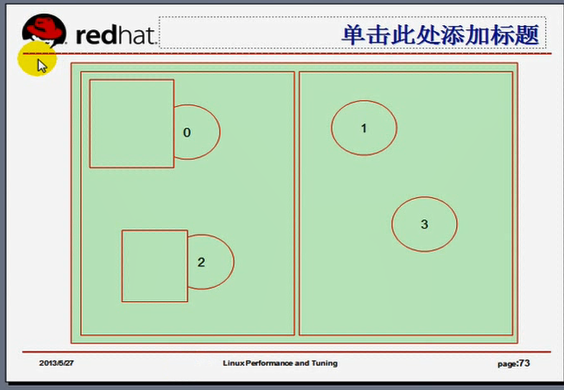
怎么去划分,我们只需要在某个位置创建一个子目录,而后挂载一个文件系统
设备 挂载点 文件系统类型 挂载选项
cpuset /cpusets cpuset defaults 0 0
挂完以后,自动在 /cpusets 下面生成了几个目录
/cpusets/cpus
/cpusets/mems
/cpusets/tasks

[root@localhost ~]# mkdir /cpusets
[root@localhost ~]# vim /etc/fstab
#
# /etc/fstab
# Created by anaconda on Wed Jul 14 21:11:42 2021
#
# Accessible filesystems, by reference, are maintained under '/dev/disk'
# See man pages fstab(5), findfs(8), mount(8) and/or blkid(8) for more info
#
/dev/mapper/VolGroup-lv_root / ext4 defaults 1 1
UUID=02ded709-9bb2-40dd-b5ba-b274ae0bd2f0 /boot ext4 defaults 1 2
/dev/mapper/VolGroup-lv_home /home ext4 defaults 1 2
/dev/mapper/VolGroup-lv_swap swap swap defaults 0 0
tmpfs /dev/shm tmpfs defaults 0 0
devpts /dev/pts devpts gid=5,mode=620 0 0
sysfs /sys sysfs defaults 0 0
proc /proc proc defaults 0 0
cpuset /cpusets cpuset defaults 0 0 #增加这一行
[root@localhost ~]# mount -a
[root@localhost ~]# mount
/dev/mapper/VolGroup-lv_root on / type ext4 (rw)
proc on /proc type proc (rw)
sysfs on /sys type sysfs (rw)
devpts on /dev/pts type devpts (rw,gid=5,mode=620)
tmpfs on /dev/shm type tmpfs (rw,rootcontext="system_u:object_r:tmpfs_t:s0")
/dev/sda1 on /boot type ext4 (rw)
/dev/mapper/VolGroup-lv_home on /home type ext4 (rw)
none on /proc/sys/fs/binfmt_misc type binfmt_misc (rw)
cpuset on /cpusets type cpuset (rw) #已挂载上
[root@localhost ~]#
[root@localhost ~]# ls /cpusets/ #有内容
cgroup.event_control memory_migrate notify_on_release
cgroup.procs memory_pressure release_agent
cpu_exclusive memory_pressure_enabled sched_load_balance
cpus(根域) memory_spread_page sched_relax_domain_level
mem_exclusive memory_spread_slab tasks(运行在这个域内的进程有哪些)
mem_hardwall mems(关联了哪些内存)
[root@localhost ~]#
[root@localhost ~]# cat /cpusets/cpus #我们有8核
0-7
[root@localhost ~]#
[root@localhost ~]# cat /cpusets/mems #哪一段内存属于这儿????若不是numa结构,所以只有一段内存,一定属于根域的
0
[root@localhost ~]#
[root@localhost ~]# cat /cpusets/tasks #所有进程都在这儿
1
2
3
4
5
6
7
8
9
10
11
12
13
14
15
16
17
18
19
20
21
22
23
24
25
26
27
28
29
30
31
32
33
34
35
36
37
38
39
40
41
42
43
44
45
46
47
48
49
50
51
52
53
54
55
56
57
58
59
60
61
62
63
64
65
66
67
68
69
70
71
72
73
74
75
76
77
78
79
80
81
82
83
84
85
86
87
88
89
90
91
92
93
94
95
96
97
98
99
100
101
102
103
104
105
106
107
108
109
110
111
112
113
114
115
116
117
118
119
120
121
124
125
126
127
128
129
130
131
132
133
134
135
136
137
138
139
140
141
142
143
144
145
146
147
148
149
150
151
158
159
160
161
162
163
164
165
166
168
169
170
203
204
243
424
425
426
437
438
565
567
633
634
669
740
926
1186
1226
1227
1228
1229
1326
1385
1390
1391
1392
1393
1394
1395
1396
1397
1406
1411
1416
1417
1418
1419
1420
1421
1422
1423
1428
1449
1683
1684
1717
1718
1719
1720
1751
1769
1791
1825
1827
1849
1881
1893
1894
1895
1926
1937
1961
1962
1963
1978
1981
2103
2120
2199
2206
2213
2240
2255
2272
2289
2335
2339
2342
2345
2347
2349
2360
2361
2368
2372
2911
2973
[root@localhost ~]#
划分子域
[root@localhost ~]# cd /cpusets/
[root@localhost cpusets]# ls
cgroup.event_control memory_migrate notify_on_release
cgroup.procs memory_pressure release_agent
cpu_exclusive memory_pressure_enabled sched_load_balance
cpus memory_spread_page sched_relax_domain_level
mem_exclusive memory_spread_slab tasks
mem_hardwall mems
[root@localhost cpusets]# mkdir domain1 #创建一个目录
[root@localhost cpusets]#
[root@localhost cpusets]# cd domain1
[root@localhost domain1]# ls #给我们自动创建了很多文件
cgroup.event_control mem_hardwall mems(有它,设定这个域内的mem)
cgroup.procs memory_migrate notify_on_release
cpu_exclusive memory_pressure sched_load_balance
cpus(有它,设定这个域内的cpu) memory_spread_page sched_relax_domain_level
mem_exclusive memory_spread_slab tasks(有它,将进程绑定在这个域内)
[root@localhost domain1]#
[root@localhost domain1]# cat cpus #此时没有内容
[root@localhost domain1]# cat mems #此时没有内容
[root@localhost domain1]# cat tasks #此时没有内容
[root@localhost domain1]#
[root@localhost domain1]# echo 0 > cpus #只绑定0号cpu
[root@localhost domain1]# echo 0 > mems #绑定0段内存,事实上我们只有0段内存
[root@localhost domain1]#
而后我们将某个进程绑定在这里的tasks上了,那么这个进程只能运行在这个cpu和这段内存上了
[root@localhost domain1]# ps axo pid,cmd
PID CMD
1 /sbin/init
2 [kthreadd]
3 [migration/0]
4 [ksoftirqd/0]
5 [stopper/0]
6 [watchdog/0]
7 [migration/1]
8 [stopper/1]
9 [ksoftirqd/1]
10 [watchdog/1]
11 [migration/2]
12 [stopper/2]
13 [ksoftirqd/2]
14 [watchdog/2]
15 [migration/3]
16 [stopper/3]
17 [ksoftirqd/3]
18 [watchdog/3]
19 [migration/4]
20 [stopper/4]
21 [ksoftirqd/4]
22 [watchdog/4]
23 [migration/5]
24 [stopper/5]
25 [ksoftirqd/5]
26 [watchdog/5]
27 [migration/6]
28 [stopper/6]
29 [ksoftirqd/6]
30 [watchdog/6]
31 [migration/7]
32 [stopper/7]
33 [ksoftirqd/7]
34 [watchdog/7]
35 [events/0]
36 [events/1]
37 [events/2]
38 [events/3]
39 [events/4]
40 [events/5]
41 [events/6]
42 [events/7]
43 [events/0]
44 [events/1]
45 [events/2]
46 [events/3]
47 [events/4]
48 [events/5]
49 [events/6]
50 [events/7]
51 [events_long/0]
52 [events_long/1]
53 [events_long/2]
54 [events_long/3]
55 [events_long/4]
56 [events_long/5]
57 [events_long/6]
58 [events_long/7]
59 [events_power_ef]
60 [events_power_ef]
61 [events_power_ef]
62 [events_power_ef]
63 [events_power_ef]
64 [events_power_ef]
65 [events_power_ef]
66 [events_power_ef]
67 [cgroup]
68 [khelper]
69 [netns]
70 [async/mgr]
71 [pm]
72 [sync_supers]
73 [bdi-default]
74 [kintegrityd/0]
75 [kintegrityd/1]
76 [kintegrityd/2]
77 [kintegrityd/3]
78 [kintegrityd/4]
79 [kintegrityd/5]
80 [kintegrityd/6]
81 [kintegrityd/7]
82 [kblockd/0]
83 [kblockd/1]
84 [kblockd/2]
85 [kblockd/3]
86 [kblockd/4]
87 [kblockd/5]
88 [kblockd/6]
89 [kblockd/7]
90 [kacpid]
91 [kacpi_notify]
92 [kacpi_hotplug]
93 [ata_aux]
94 [ata_sff/0]
95 [ata_sff/1]
96 [ata_sff/2]
97 [ata_sff/3]
98 [ata_sff/4]
99 [ata_sff/5]
100 [ata_sff/6]
101 [ata_sff/7]
102 [ksuspend_usbd]
103 [khubd]
104 [kseriod]
105 [md/0]
106 [md/1]
107 [md/2]
108 [md/3]
109 [md/4]
110 [md/5]
111 [md/6]
112 [md/7]
113 [md_misc/0]
114 [md_misc/1]
115 [md_misc/2]
116 [md_misc/3]
117 [md_misc/4]
118 [md_misc/5]
119 [md_misc/6]
120 [md_misc/7]
121 [linkwatch]
124 [khungtaskd]
125 [lru-add-drain/0]
126 [lru-add-drain/1]
127 [lru-add-drain/2]
128 [lru-add-drain/3]
129 [lru-add-drain/4]
130 [lru-add-drain/5]
131 [lru-add-drain/6]
132 [lru-add-drain/7]
133 [kswapd0]
134 [ksmd]
135 [khugepaged]
136 [aio/0]
137 [aio/1]
138 [aio/2]
139 [aio/3]
140 [aio/4]
141 [aio/5]
142 [aio/6]
143 [aio/7]
144 [crypto/0]
145 [crypto/1]
146 [crypto/2]
147 [crypto/3]
148 [crypto/4]
149 [crypto/5]
150 [crypto/6]
151 [crypto/7]
158 [kthrotld/0]
159 [kthrotld/1]
160 [kthrotld/2]
161 [kthrotld/3]
162 [kthrotld/4]
163 [kthrotld/5]
164 [kthrotld/6]
165 [kthrotld/7]
166 [pciehpd]
168 [kpsmoused]
169 [usbhid_resumer]
170 [deferwq]
203 [kdmremove]
204 [kstriped]
243 [ttm_swap]
424 [mpt_poll_0]
425 [mpt/0]
426 [scsi_eh_0]
437 [scsi_eh_1]
438 [scsi_eh_2]
565 [kdmflush]
567 [kdmflush]
633 [jbd2/dm-0-8]
634 [ext4-dio-unwrit]
669 [flush-253:0]
740 /sbin/udevd -d
926 [vmmemctl]
1186 [kdmflush]
1226 [jbd2/sda1-8]
1227 [ext4-dio-unwrit]
1228 [jbd2/dm-2-8]
1229 [ext4-dio-unwrit]
1326 [kauditd]
1385 [ib_addr]
1390 [infiniband/0]
1391 [infiniband/1]
1392 [infiniband/2]
1393 [infiniband/3]
1394 [infiniband/4]
1395 [infiniband/5]
1396 [infiniband/6]
1397 [infiniband/7]
1406 [ib_mcast]
1411 [iw_cm_wq]
1416 [ib_cm/0]
1417 [ib_cm/1]
1418 [ib_cm/2]
1419 [ib_cm/3]
1420 [ib_cm/4]
1421 [ib_cm/5]
1422 [ib_cm/6]
1423 [ib_cm/7]
1428 [rdma_cm]
1449 [ipoib_flush]
1683 auditd
1717 /sbin/rsyslogd -i /var/run/syslogd.pid -c 5
1751 irqbalance --pid=/var/run/irqbalance.pid
1769 rpcbind
1791 rpc.statd
1825 dbus-daemon --system
1849 cupsd -C /etc/cups/cupsd.conf
1881 /usr/sbin/acpid
1893 hald
1894 hald-runner
1926 hald-addon-input: Listening on /dev/input/event2 /dev/input/event0
1937 hald-addon-acpi: listening on acpid socket /var/run/acpid.socket
1961 automount --pid-file /var/run/autofs.pid
2103 /usr/sbin/mcelog --daemon
2120 /usr/sbin/sshd
2199 /usr/libexec/postfix/master
2206 qmgr -l -t fifo -u
2213 /usr/sbin/abrtd
2240 crond
2255 /usr/sbin/atd
2272 /usr/bin/rhsmcertd
2289 /usr/sbin/certmonger -S -p /var/run/certmonger.pid
2335 /sbin/mingetty /dev/tty1
2339 /sbin/mingetty /dev/tty2
2342 /sbin/mingetty /dev/tty3
2345 /sbin/mingetty /dev/tty4
2347 /sbin/mingetty /dev/tty5
2349 /sbin/mingetty /dev/tty6
2360 /sbin/udevd -d
2361 /sbin/udevd -d
2368 sshd: root@pts/0
2372 -bash
2911 pickup -l -t fifo -u
3079 /usr/sbin/httpd
3081 /usr/sbin/httpd
3082 /usr/sbin/httpd
3083 /usr/sbin/httpd
3084 /usr/sbin/httpd
3085 /usr/sbin/httpd
3086 /usr/sbin/httpd
3087 /usr/sbin/httpd
3088 /usr/sbin/httpd #绑定它吧
3090 ps axo pid,cmd
[root@localhost domain1]#
[root@localhost domain1]# echo 3088 > tasks #绑下进程,,此时3088的进程只能运行在这个cpu上了
[root@localhost domain1]#
[root@localhost domain1]# man ps
........................................................................................
psr PSR processor that process is currently assigned to. #ps 命令能显示进程运行在哪个cpu上
........................................................................................
[root@localhost domain1]# ps -e -o psr,pid,cmd | grep httpd
2 3079 /usr/sbin/httpd
3 3081 /usr/sbin/httpd
4 3082 /usr/sbin/httpd
3 3083 /usr/sbin/httpd
4 3084 /usr/sbin/httpd
3 3085 /usr/sbin/httpd
4 3086 /usr/sbin/httpd #不在0号cpu上????
3 3087 /usr/sbin/httpd
4 3088 /usr/sbin/httpd
5 3133 grep httpd
[root@localhost domain1]#
[root@localhost domain1]# cat tasks # 已绑定了进程
3088
[root@localhost domain1]#
[root@localhost domain1]# watch -n 0.5 'ps -e -o psr,pid, cmd | grep httpd' #观察命令的执行
Every 0.5s: ps -e -o psr,pid,cmd | grep httpd Fri Jul 16 10:39:02 2021
2 3079 /usr/sbin/httpd
3 3081 /usr/sbin/httpd
4 3082 /usr/sbin/httpd
3 3083 /usr/sbin/httpd
4 3084 /usr/sbin/httpd
3 3085 /usr/sbin/httpd
4 3086 /usr/sbin/httpd
3 3087 /usr/sbin/httpd
4 3088 /usr/sbin/httpd
1 3139 watch -n 0.5 ps -e -o psr,pid,cmd | grep httpd #随时动,切换cpu
3 3239 sh -c ps -e -o psr,pid,cmd | grep httpd #随时动,切换cpu
5 3241 grep httpd #随时动,切换cpu
重开一下putty窗口,做压力测试
[root@localhost ~]# ab -n 10000 -c 300 http://127.0.0.1/index.php
This is ApacheBench, Version 2.3 <$Revision: 655654 $>
Copyright 1996 Adam Twiss, Zeus Technology Ltd, http://www.zeustech.net/
Licensed to The Apache Software Foundation, http://www.apache.org/
Benchmarking 127.0.0.1 (be patient)
Completed 1000 requests
Completed 2000 requests
Completed 3000 requests
Completed 4000 requests
Completed 5000 requests
Completed 6000 requests
Completed 7000 requests
Completed 8000 requests
Completed 9000 requests
Completed 10000 requests
Finished 10000 requests
Server Software: Apache/2.2.15
Server Hostname: 127.0.0.1
Server Port: 80
Document Path: /index.php
Document Length: 283 bytes
Concurrency Level: 300
Time taken for tests: 1.441 seconds
Complete requests: 10000
Failed requests: 0
Write errors: 0
Non-2xx responses: 10000
Total transferred: 4640000 bytes
HTML transferred: 2830000 bytes
Requests per second: 6938.20 [#/sec] (mean)
Time per request: 43.239 [ms] (mean)
Time per request: 0.144 [ms] (mean, across all concurrent requests)
Transfer rate: 3143.87 [Kbytes/sec] received
Connection Times (ms)
min mean[+/-sd] median max
Connect: 0 1 24.5 0 1000
Processing: 0 28 157.6 9 1412
Waiting: 0 28 157.6 9 1412
Total: 4 30 160.7 9 1422
Percentage of the requests served within a certain time (ms)
50% 9
66% 10
75% 11
80% 11
90% 12
95% 13
98% 26
99% 1416
100% 1422 (longest request)
[root@localhost ~]#
[root@localhost domain1]# ps -e -o psr,pid,cmd | grep httpd
Every 0.5s: ps -e -o psr,pid,cmd | grep httpd Fri Jul 16 10:47:02 2021
2 3079 /usr/sbin/httpd
1 3081 /usr/sbin/httpd
4 3082 /usr/sbin/httpd
1 3083 /usr/sbin/httpd
4 3084 /usr/sbin/httpd
5 3085 /usr/sbin/httpd
5 3086 /usr/sbin/httpd
6 3087 /usr/sbin/httpd
0 3088 /usr/sbin/httpd #另一putty窗口做了压力测试后,看到此进程在0号cpu上了,,它被重新调度了,,无论别人怎么调度,它一直在0号cpu上了
6 3139 watch -n 0.5 ps -e -o psr,pid,cmd | grep httpd
6 5929 /usr/sbin/httpd
3 5937 /usr/sbin/httpd
3 5938 /usr/sbin/httpd
0 6083 sh -c ps -e -o psr,pid,cmd | grep httpd
6 6085 grep httpd
上面的划分子域的这些数据都是echo过来的,下次重启就没有了?????为什么?????这个文件系统仍然会在,因为开机自动挂载了,,,,但是 /cpusets 目录下的非自动生成的子目录可能就不存在了,
另一种方法taskset绑定吧
[root@localhost domain1]# ps -e -o psr,pid,cmd | grep httpd
0 508 grep httpd
2 3079 /usr/sbin/httpd
5 3081 /usr/sbin/httpd
1 3087 /usr/sbin/httpd
0 3088 /usr/sbin/httpd
7 5938 /usr/sbin/httpd
1 6813 /usr/sbin/httpd
1 6821 /usr/sbin/httpd
3 6824 /usr/sbin/httpd
2 6826 /usr/sbin/httpd
1 6838 /usr/sbin/httpd
3 6842 /usr/sbin/httpd
2 6844 /usr/sbin/httpd
1 6846 /usr/sbin/httpd
1 6848 /usr/sbin/httpd
2 6850 /usr/sbin/httpd
3 6867 /usr/sbin/httpd
2 6880 /usr/sbin/httpd
3 6882 /usr/sbin/httpd
3 6883 /usr/sbin/httpd
0 6885 /usr/sbin/httpd
2 6886 /usr/sbin/httpd
[root@localhost domain1]#
[root@localhost domain1]# taskset -p -c 0 3087 #将进程3087绑定到0号cpu,,, -p -c 的顺序不能错
pid 3087's current affinity list: 0-7
pid 3087's new affinity list: 0
[root@localhost domain1]#
[root@localhost domain1]# taskset -c 0 -p 3087 #顺序一错,就错了
execvp: No such file or directory
failed to execute -p
[root@localhost domain1]#
[root@localhost domain1]# taskset -p -c 1 3087 #将进程3087绑定到1号cpu
pid 3087's current affinity list: 0
pid 3087's new affinity list: 1
[root@localhost domain1]#
cpu调优当中,要观察cpu的负载,观察cpu的各种统计数据,像中断数,上下文切换数,用户空间占据的百分比,,内核空间占据的百分比,io等待的时间等等,这些值对我们都很关键,每一个值都代表着一定的意义,,,正常用户空间与内核空间的比为7:3,,,cpu的使用率不要超过80%,若长期超过80%,意味着cpu已经出现瓶颈了,意味着系统可能由于太繁忙,将来可能会在某一时刻挂掉的,,,,,,,在非常繁忙的时刻,如果cpu是多核的,它的使用率可能会达到百分之几百,(如七八百,看有几核的),,,,,,,,,如果上下文切换的次数过多,而且有些进程可能因为非常繁忙老是切换来切换去的,可以实现绑定,,,,,在numa体系结构当中,应该将某些被重新平衡切换的进程绑定在某一个node?????上(或者某一个cpu上),进而实现它只在当前node上运行,而且它的数据也只在当前node上装载,,,,我们手动绑定进程到cpu也可以,taskset或者 cpuset文件系统,,,,这是跟cpu调整相关的内容,,,像dstat,sar,iostat这三个命令很重要,
